
This guest post by pseudonymous Dayo Maor is another tutorium on how to become a science sleuth. This reader of my site comments on PubPeer as Thallarcha Lechrioleuca, having reported in the past month oodles of manipulated data in papers on nanotechnology and material sciences. Their technique: the Google image search function, and the results are astounding. It is definitely not just western blots which get photoshopped (these are actually very difficult to falsify convincingly), in fact spectra analyses are ridiculously easy to fake as long as nobody asks to provide raw data. Which nobody ever does, while fraudsters keep publishing one fabricated materials science paper after another, as a recent case from Mexico proved.
Everyone can join in the search, you don’t need to be an expert or even a scientist: all you need is a good eye for spotting duplications and other irregularities, as the work by science outsider Cheshire proves (see their guest post here).
One of the big data forgers whom Dayo Maor flushed out over this short period of time, is Xiangke Wang, a colleague of a certain Yubing Sun at North China Electric Power University whose fraudulent works and citation scams already featured on my site. Another bizarre case was that of the British materials scientist David Evans, member of Royal Society for Chemistry (RSC), who went to China to teach children chemistry and apparently also to lend his name as coauthor on a series of falsified chemistry papers, so these can be smuggled into high-impact journals.
What Dayo Maor also found: the Linköping University in Sweden (former home of research fraudster and scamference organiser Ashutosh Tiwari and of scandal-ridden and litigious May Griffith, both of whom tried to bribe me to delete my articles) might host yet another group of dishonest materials science researchers: a recent paper from Omer Nur lab contains a bluntly falsified spectra figure. Its co-author Magnus Willander recently retired as Linköping professor with a record of 850 (!) papers published.
The invitation to you now is: #CleanYourScience. Join Dayo Maor in googling key words in your research field, and record on PubPeer (or in the comment section below) what fabricated figures you might have discovered.
Manual on finding flawed research data
Thallarcha Lechrioleuca invites Flashmob #CleanYourScience
By Dayo Maor
The problems related to cut and paste of spectra become so massive that it is sufficient to type in any 2-3 research terms into Google image search, and then to scroll down for images to find some copy-paste examples. How many you will find depends on research field? Some are more infected, some less. I could hardly believe it myself, but now it is tested in randomly selected research fields.
Science need your help to reveal the true scale of this problem. Therefore, I invite everybody to join our FlashMob #CleanYourScience. Anyone who played “memory” or “spot the differences” game will be able to find problematic research data which are worth further questioning. You don’t need to be scientist to spot these issues. Below I provide detailed instructions how to search for problems and provide examples.
Introduction
The idea is very simple: we spent an hour or two (or as much as you can) to scan research data for problems and to post it all on PubPeer or in social networks, or as a comment below this article. You can choose to add hashtag to your posts to mark our Flashmob: #CleanYourScience. It might be hard to believe but already after spending 5-10 minutes you are very likely to find clearly problematic figures.
Don’t believe me? Feel welcome to do this experiment and to see for yourself. I will be happy to know if your own research field is clean!
Our main tool is Google image search. Examples of search: first word is name of material, e.g. “nanoparticles” , second word is the method like “spectra” or “XRD” or “Raman” or whatever else. Both XRD and Raman spectra are typically recorded with unique random noise. Any other spectroscopy methods which provide well-visible noise are also worth to be checked. Name of material can be replaced with name of device, e.g. battery, fuel cell, solar cell etc.
As an experiment I googled several rather general combinations of words. Almost all of them sooner or later revealed problematic figures. After a while, I realized that one person can’t handle so much work. That is how idea of this Flashmob was born.
That is why I am asking you, dear readers, to help Science to correct itself. Take your own research field or random area of interest and invest time to reveal true scale of the problem. It will help to clean up your own research field, it will help to save time of many researchers, it will save a lot of money wasted on attempts to reproduce fake results.
Experimental procedures
We start with easy case of “core shell” and “XRD”. Thanks to Smut Clyde for his publications about core-shell nanoparticles we know it is rather problematic research field.
Step 1 Type in Google “core shell” and “XRD”
Step 2. Click on images. Now scroll down images until you might see something strange. Click on a suspect image to see enlarged variant. In most cases it is sufficient to reveal some problems, in other cases one need to download paper and to magnify images. What will you see on screen partly depends on previous searches. While writing this post, I saw the following:
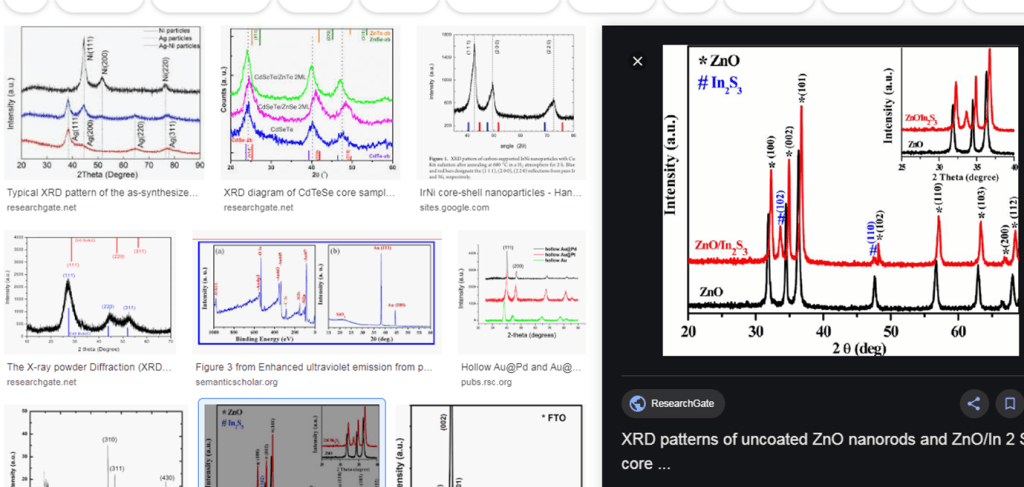
The figure which I found in the third line of images attracts my attention. I zoom on background and find some unexpected similarities. It is not yet on PubPeer.
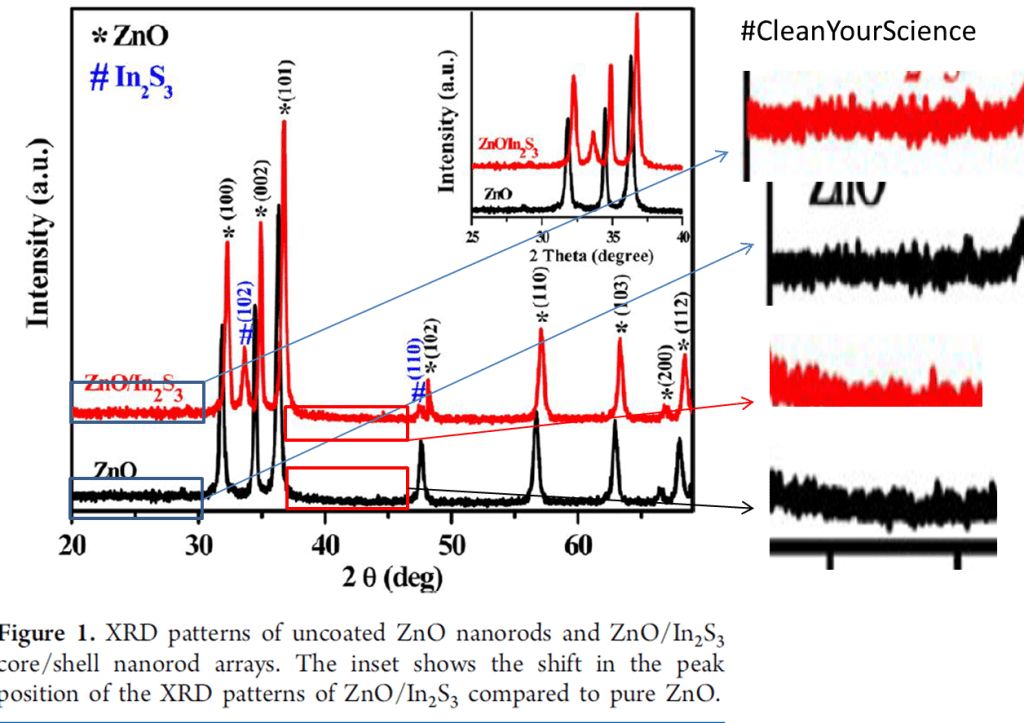
The figure claims to show difference between ZnO and ZnO/In2S3. I zoom on small sections of background and shift them relative to each other to find out that the noise pattern is identical. The inset of the figure claims that this shift is natural property of materials. How the peaks of In2S3 were added to the XRD pattern I can only guess. Leonid once introduced the concept “Zombie Scientists”. “Zombie spectra” is suitable name for dead spectra produced by cut- and- paste method.
Results
One line of images below I found this figure:
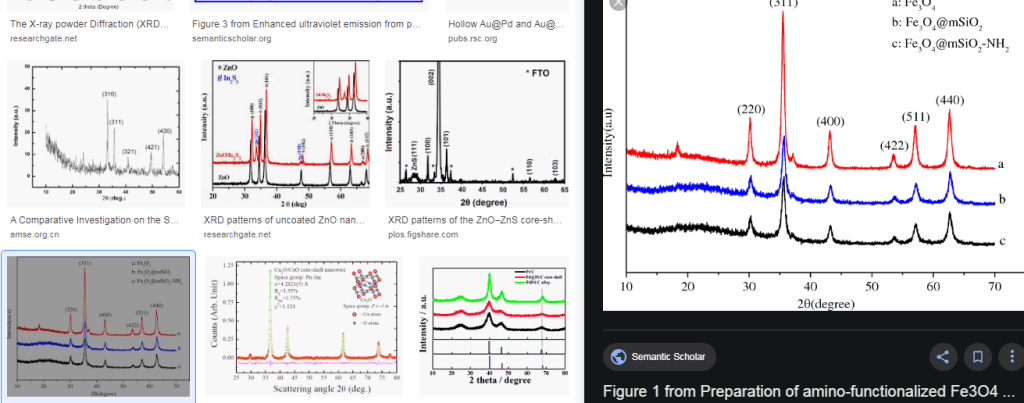
The patterns b and c are identical. That is not yet smoking gun but something worth to ask authors to explain. It can be simple human error but in any case, one which requires a correction. The patterns supposed to represent different samples. That one is already on Pubpeer and I scroll down.
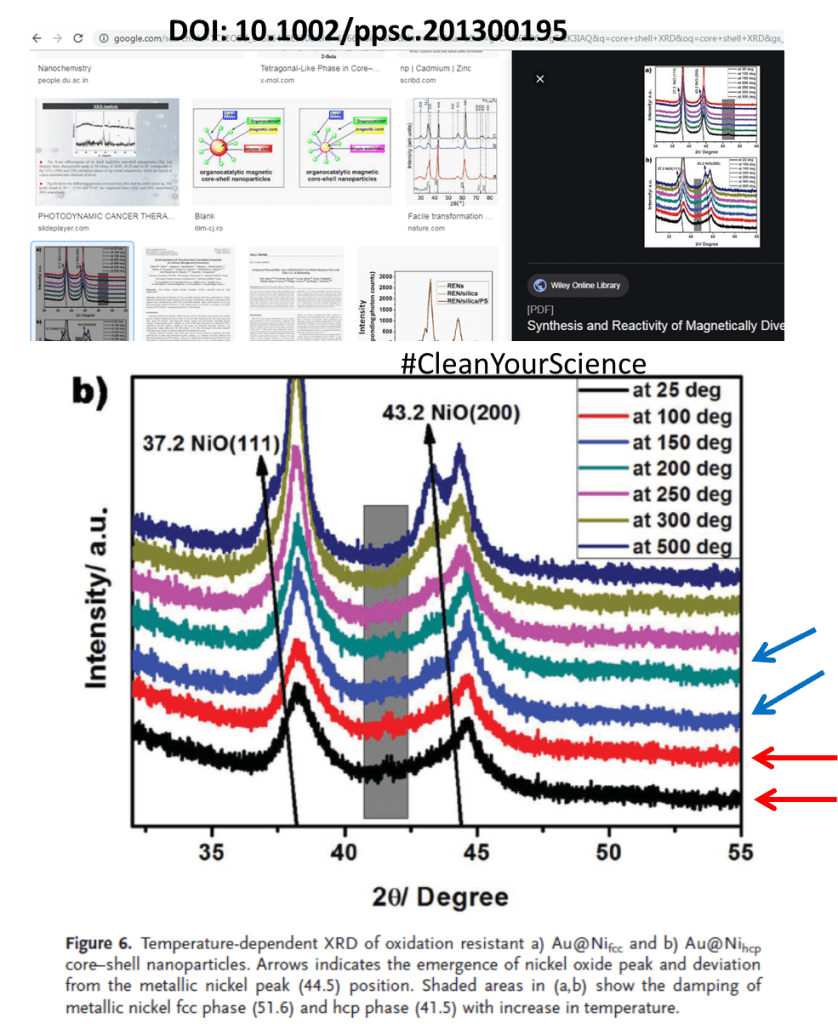
Next one is much more difficult to explain with human error because there are two pairs of identical patterns slightly shifted to show temperature trend:
If you think that two pairs of identical spectra in one figure is not impressive, check the next figure which I found using combination of words “global warming” and XRD. Scientific Reports is often referred simply as “Nature journal” and authors had to pay $1790 to publish the following figures:

I don’t think it is necessary to mark these figures to realize that four XRD patterns are identical in the Figure 2a (left) and four spectra are identical in the Figure 2c (right). Some points were possibly modified but otherwise it is the same pattern/spectrum quadruplicated to represent different holey graphene samples. The paper cites these materials as excellent adsorbents for CO2. Somehow I don’t believe that this research will help to fight global warming. Not yet on Pubpeer!
It would be wrong to assume that the problem of zombie spectra is located only within certain geographical areas. Here is for example a paper published by two UK scientists Eric Masika and Robert Mokaya representing University of Nottingham. Robert Mokaya is “Professor of Materials Chemistry and Pro-Vice-Chancellor for Global Engagement, Faculty of VC’s Office”, according to his web page.
This paper was found using combination of words “sorption” and “XRD” after some scrolling down the page. First we look at Figure 1 of Masika & Mokaya 2013, which shows unusual combination of small repetitions and identical noise in blue and brown patterns for certain range of angles. At lower angles the patterns for some strange reason become different as it should be for two different materials.
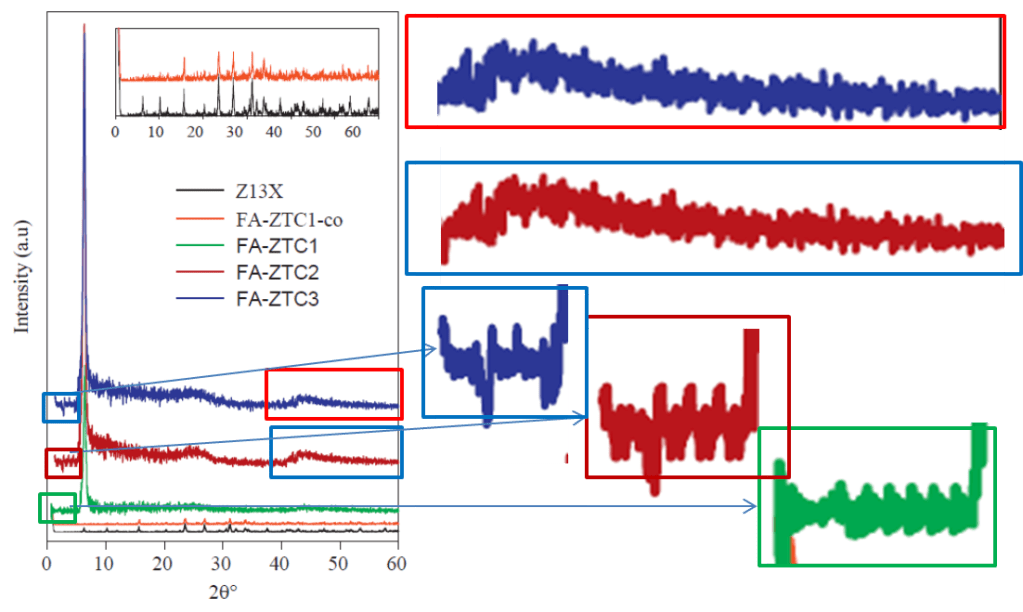
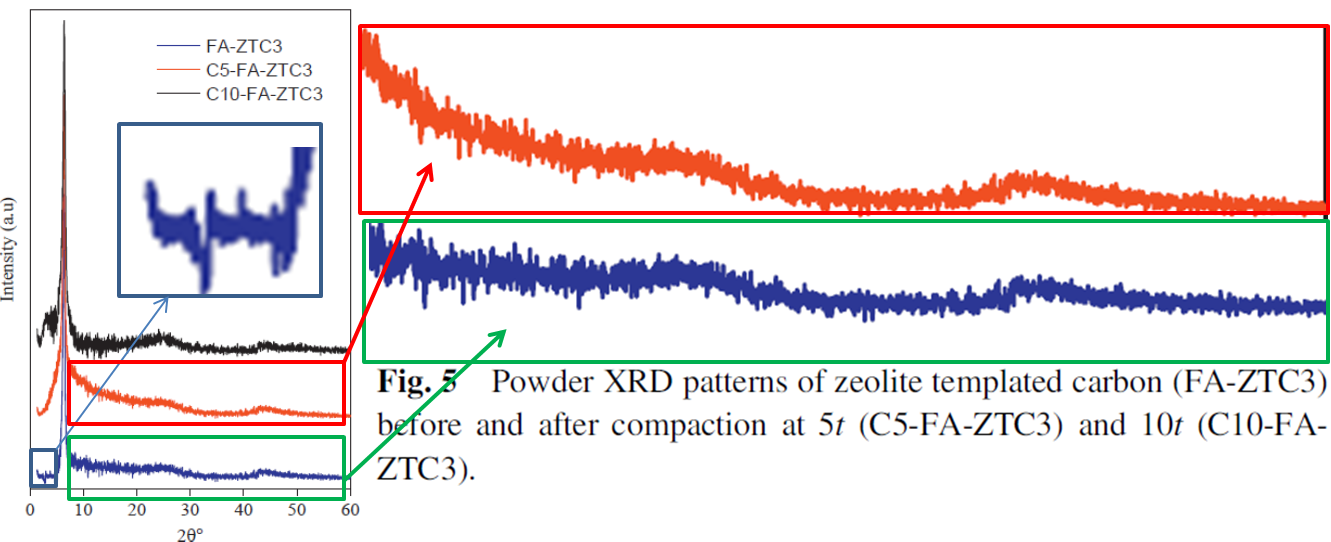
Figure 5 suggest that authors subtracted some background from one pattern to present it as different and attached these pieces to something else for better results. The journal which published these zombie XRD patterns is Progress in Natural Science: Materials International (IF=3.3) by Elsevier.
For those readers who want to enjoy this figure a second time, it was published again in 2013 in Energy & Environmental Science (DOI: 10.1039/c3ee42239a), an RSC journal with IF=33 (!) at the moment. No doubt 46 citations of Eric Masika’s and Robert Mokaya’s paper helped to achieve this impressive impact factor. Not yet on PubPeer.

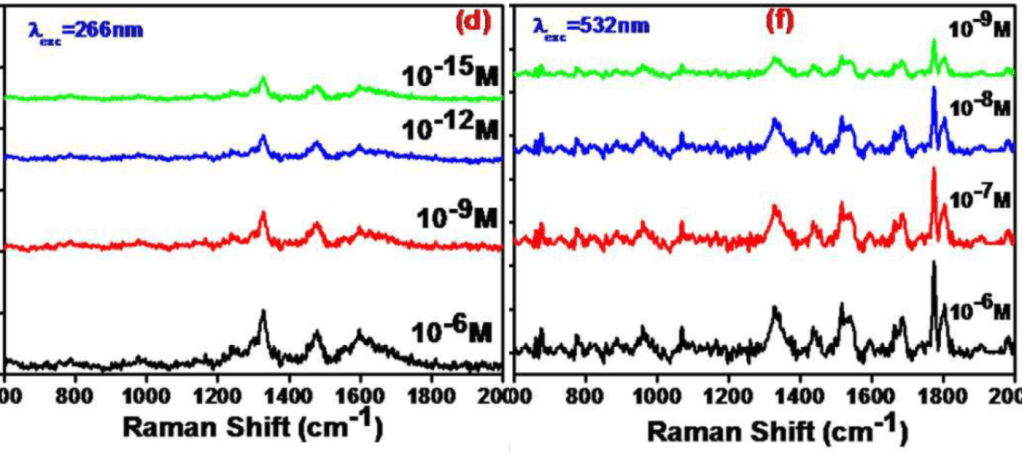
Just for fun I tested completely absurd combinations of words. For example “UFO” with “Raman spectra”. It took me exactly 3 minutes to find that UFOs (doi: 10.1039/C8AN00341F) prefer to present the same spectra in multiple numbers in the same figures. Figure 4 offers two examples (f and d). Figure 4d presents unconvincing attempts to hide similarity between all 4 (!) spectra by compressing them along vertical axis. Yet for Figure 4f the authors realized that their attempts were an effort wasted (nobody reads their papers anyway, right?) and decided to dump 3 identical spectra on the same plot without any modifications. Green spectrum is likely also to be the same but slightly compressed.
Also, XRD patterns in Figure 1( (c) Rh nanocube and (d) Rh tripod nanoparticles) also appear to be identical (not shown here) in this paper published by the Royal Society of Chemistry journal Analyst (IF=4). I did not bother to check other figures. Anyone interested to find out how UFOs are related to the copy-paste art in this paper must pay £42.50 to RSC. Not yet on PubPeer.
If you think that four identical spectra in one graph is not enough, here is example with five (doi: 10.1039/c8ra06896h), and this time it is from the Linköping University in Sweden:
There is only some vertical compression distinguishing between the top 5 XRD patterns, all allegedly showing different materials.
After a hard day’s night, I tried a Google search using “Beatles” and “XRD”. Let it be: This research field is clean, no XRD patterns were found. The search for “Gandalf” and “XRD” actually returned some XRD figures but not many. Maybe Gandalf used his magic to make them clean.
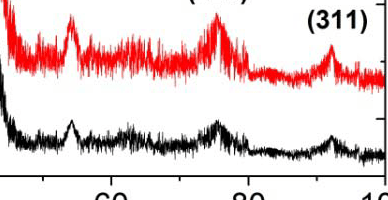
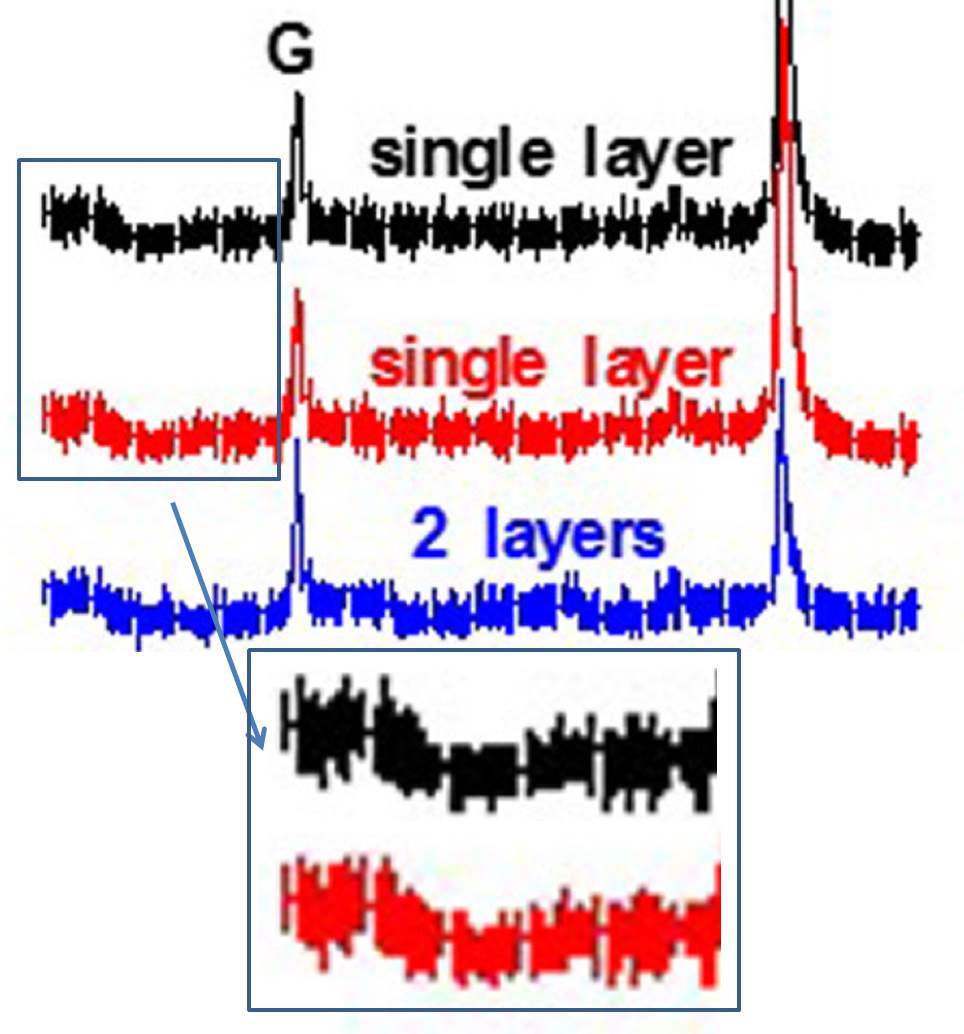
You might think that examples shown above are too difficult to uncover. There are many easier cases however, searchable by different combinations of words, for example “nanohybrid” and “Raman”. The next example shows Raman spectra which are not just a smoking gun but rather smoke columns from some massive carpet bombing. Not yet on PubPeer.
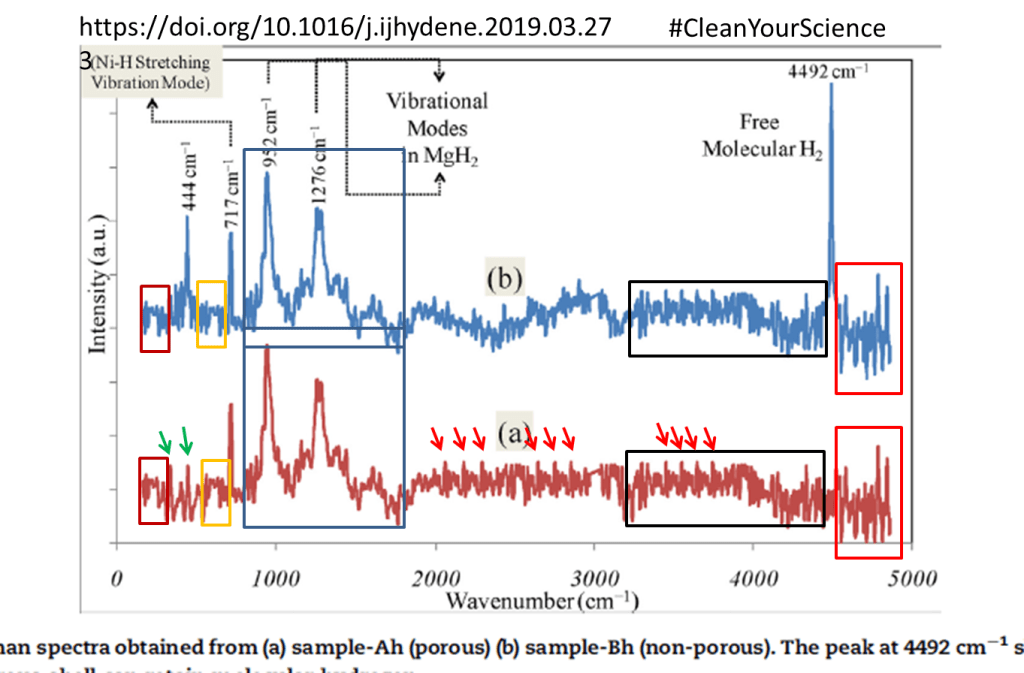
Authors of this paper could only hope that nobody will ever look into their work properly. Possibly they were right, at least about reviewers and editors who accepted it for publication. International Journal of Hydrogen Energy has IF =4.084 by the way. A Google image search with the name of first author “Anshul Gupta” and “Raman spectra” shows more copy-paste (not yet on PubPeer).
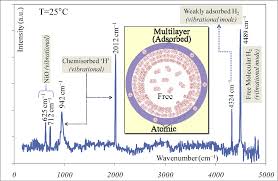
What we see here is obviously old “spectrum” with new peaks, e.g. one at 2012 cm-1 and one peak cut off at 952 cm-1. The main achievement of this paper is claimed to be hydrogen storage “enhancement by a factor of 7 × 10³ (7,00,000%)”. Moving on to next examples.
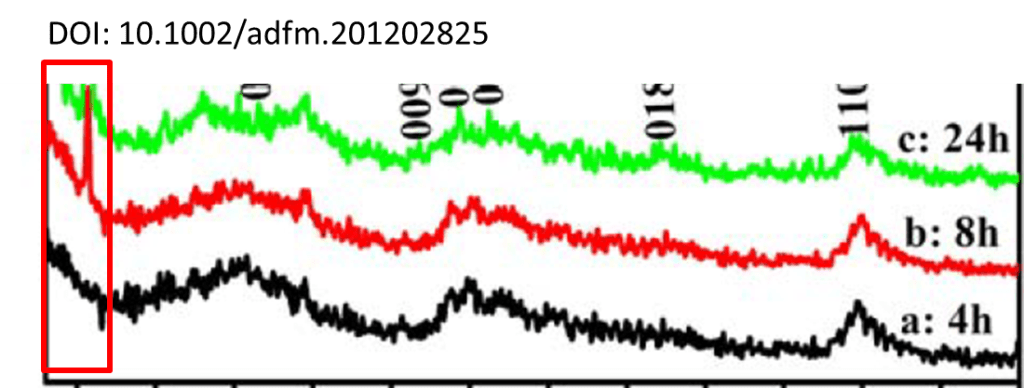
You might think such problems are found only in low-rank journals and well-forgotten papers with no citations. Rare as it might be (no statistics available), but even “high profile” journals are not free from zombie spectra. Recent PubPeer entries provide some illustrations. For example, the supporting information file of a paper published in Advanced Functional Materials (IF=15.6), coauthored by RSC member David Evans and cited 65 times, shows the following figure with an extra peak added to an otherwise identical XRD pattern:
Next example is from Journal of Materials Chemistry (IF=10.7), the paper was cited 113 times.

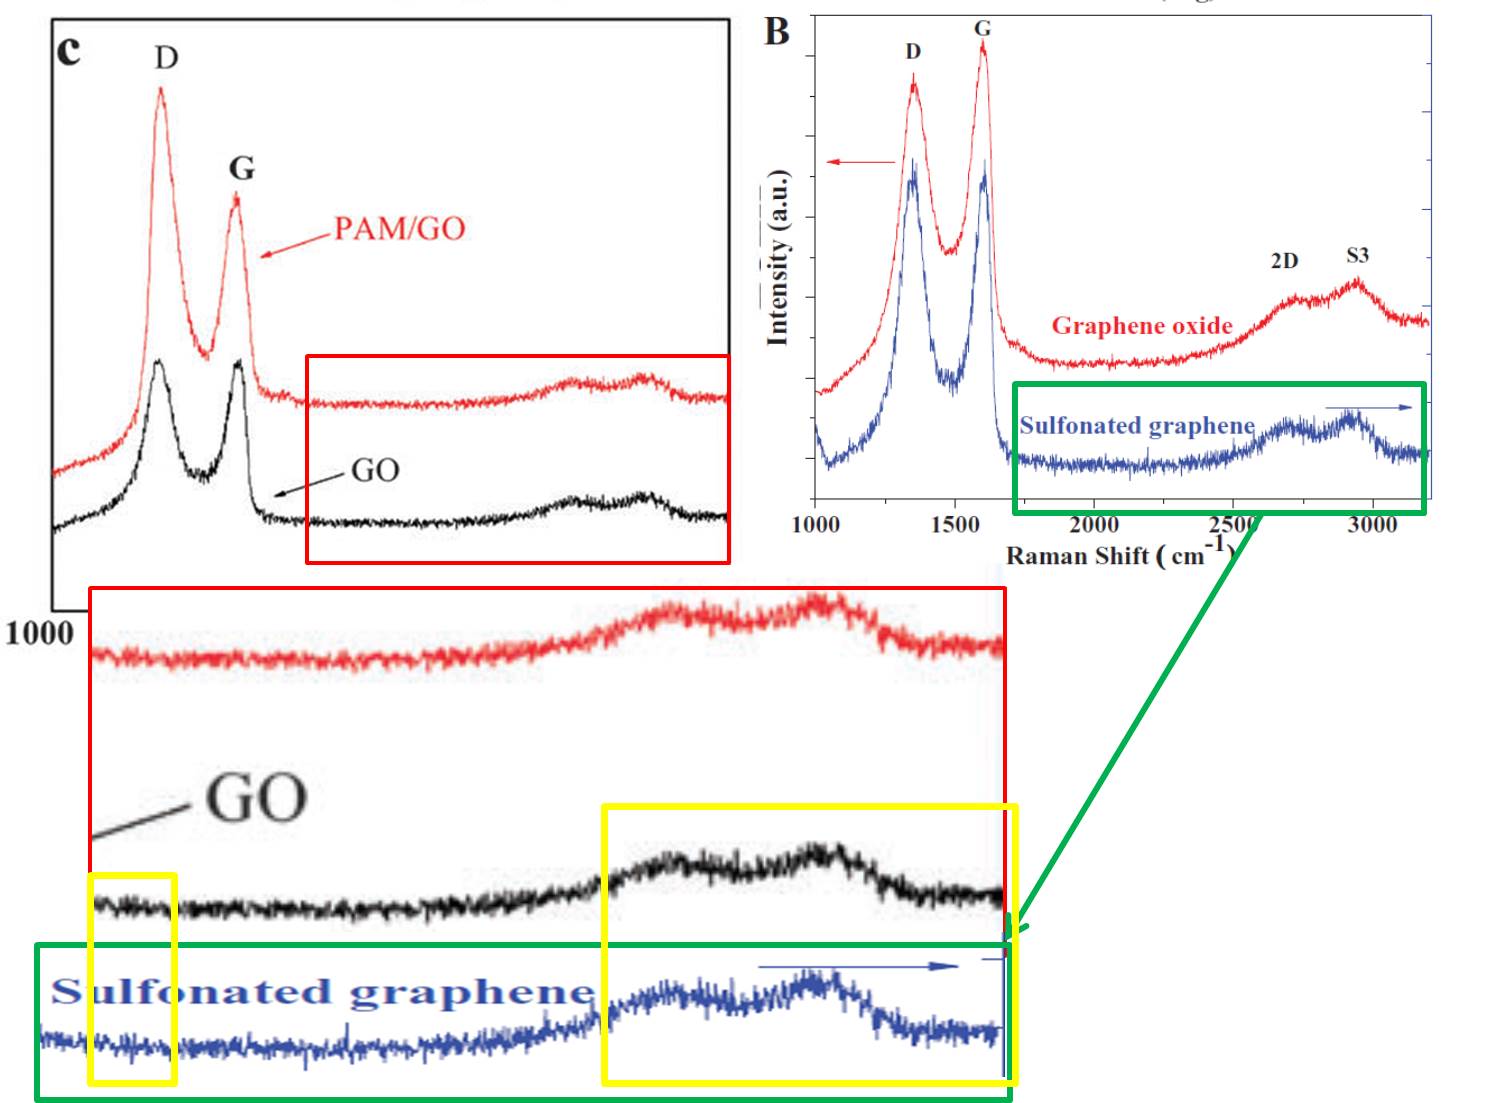
The PubPeer thread for that paper includes copy-pasted fragments of the same spectra in several other publications with one name in common: Prof. Xiangke Wang. Impressive PubPeer record of that author includes now over 40 papers with many examples of zombie spectra. Same Wang is responsible for a paper published in Advanced Materials (IF=25.8), cited over 570 times. The noise in the Raman spectra of GO and sulfonated graphene is unexpectedly similar:
Discussion
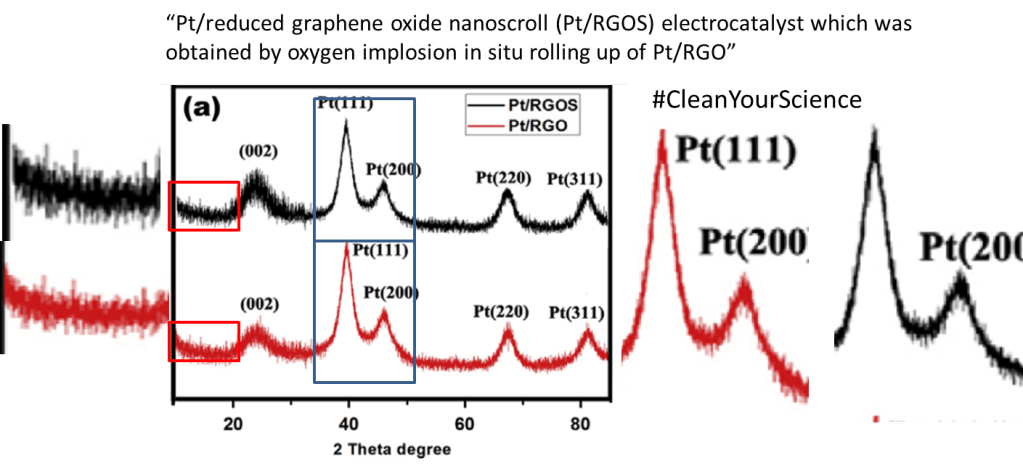
- Fashionable research fields and flashy buzzwords attract problematic figures. Nanohybrids, nanoparticles, nanospheres, nanocomposites, nanobelts, nanoscrolls, whatever “nano” are some of obvious choices. Words like “superior”, “graphene”, “hierarchical”, “designed” could be a good addition. Think about research tops of past years like “fullerenes”, “nanotubes,” “superconductivity”. These might be worth to look into!
Here I tested my own suggestion by typing “nanoscrolls” and “XRD”. First page of images showed one with sudden change in amplitude of noise for one part of patterns (doi:10.1088/0957-4484/24/23/235401). I decided to look closer. Authors invested a good deal of time (possibly more than required to record real pattern) into combining pieces of this puzzle into zombie patterns. Some parts are extremely similar, some not. Not yet on PubPeer.
- One can renew past search while applying time limitations to skip already searched papers. Something like “core shell”, “XRD” and selecting 2012-2014 for time interval is worth to try. Maybe even journal titles can be used as well.
- Add your specific material to the search, like Fe3O4, SiO2, “nanotube” in combination with “nano” or “XRD”, “spectra” etc. You can search also using names of city, country or the academic institution.
Again as a test I picked up “nanodiamonds” and XRD after writing this text. Third line of images shows me something with bright colors and unusual change in the noise amplitude (not yet on PubPeer) doi: 10.1109/TDEI.2015.004678.

What we see here is a strong difference for two major peaks below ~45 degrees and a very strange pattern at higher angles. The patterns in this angle region are almost identical except for compression along vertical axis. I intentionally left it as it was. Some parts are clearly identical and some are not. Can you spot it?
- Combinations of rather bright colours and abnormal shape of peaks is something which often catches my attention. Many figures also show very strange background noise as if it was drawn by hand or smoothed to a degree of a continuous merge. In that case, if no repetition patterns are found these are not smoking guns (unfortunately).
- Abrupt changes in frequency or the amplitude of noise are an alarm sign. It might happen due to natural reasons but very often this marks the point where parts of XRD pattern or fragments of spectra were stitched together. In the worst cases one can even see some breaks between connected parts. Some figures of that kind I have real difficulty to explain:
doi: 10.1088/1361-6463/aa5445
I think it is secret message written using hieroglyphs. Only smart people are able understand it. I am not smart. The spectra supposed to be recorded in different spots of some sample. Some of the fragments connected by straight lines are very similar, some are not. Why reviewers have not questioned the meaning of that message I have no idea.
- Some figures require really strong zoom-in to reveal problems, authors presumably trust that nobody is interested in details. That may be the case in many papers where data is nothing more but decoration, not expected to support any claims. Like that zombie XRD for example:

One don’t need to be a dentist to find some similarities (and differences, marked) between the green and the blue XRD teeth patterns.
- Problems are even more often found in supporting information (SI) files. Here is an example of what can be found by comparing two figures in SI files of two “high profile” papers:
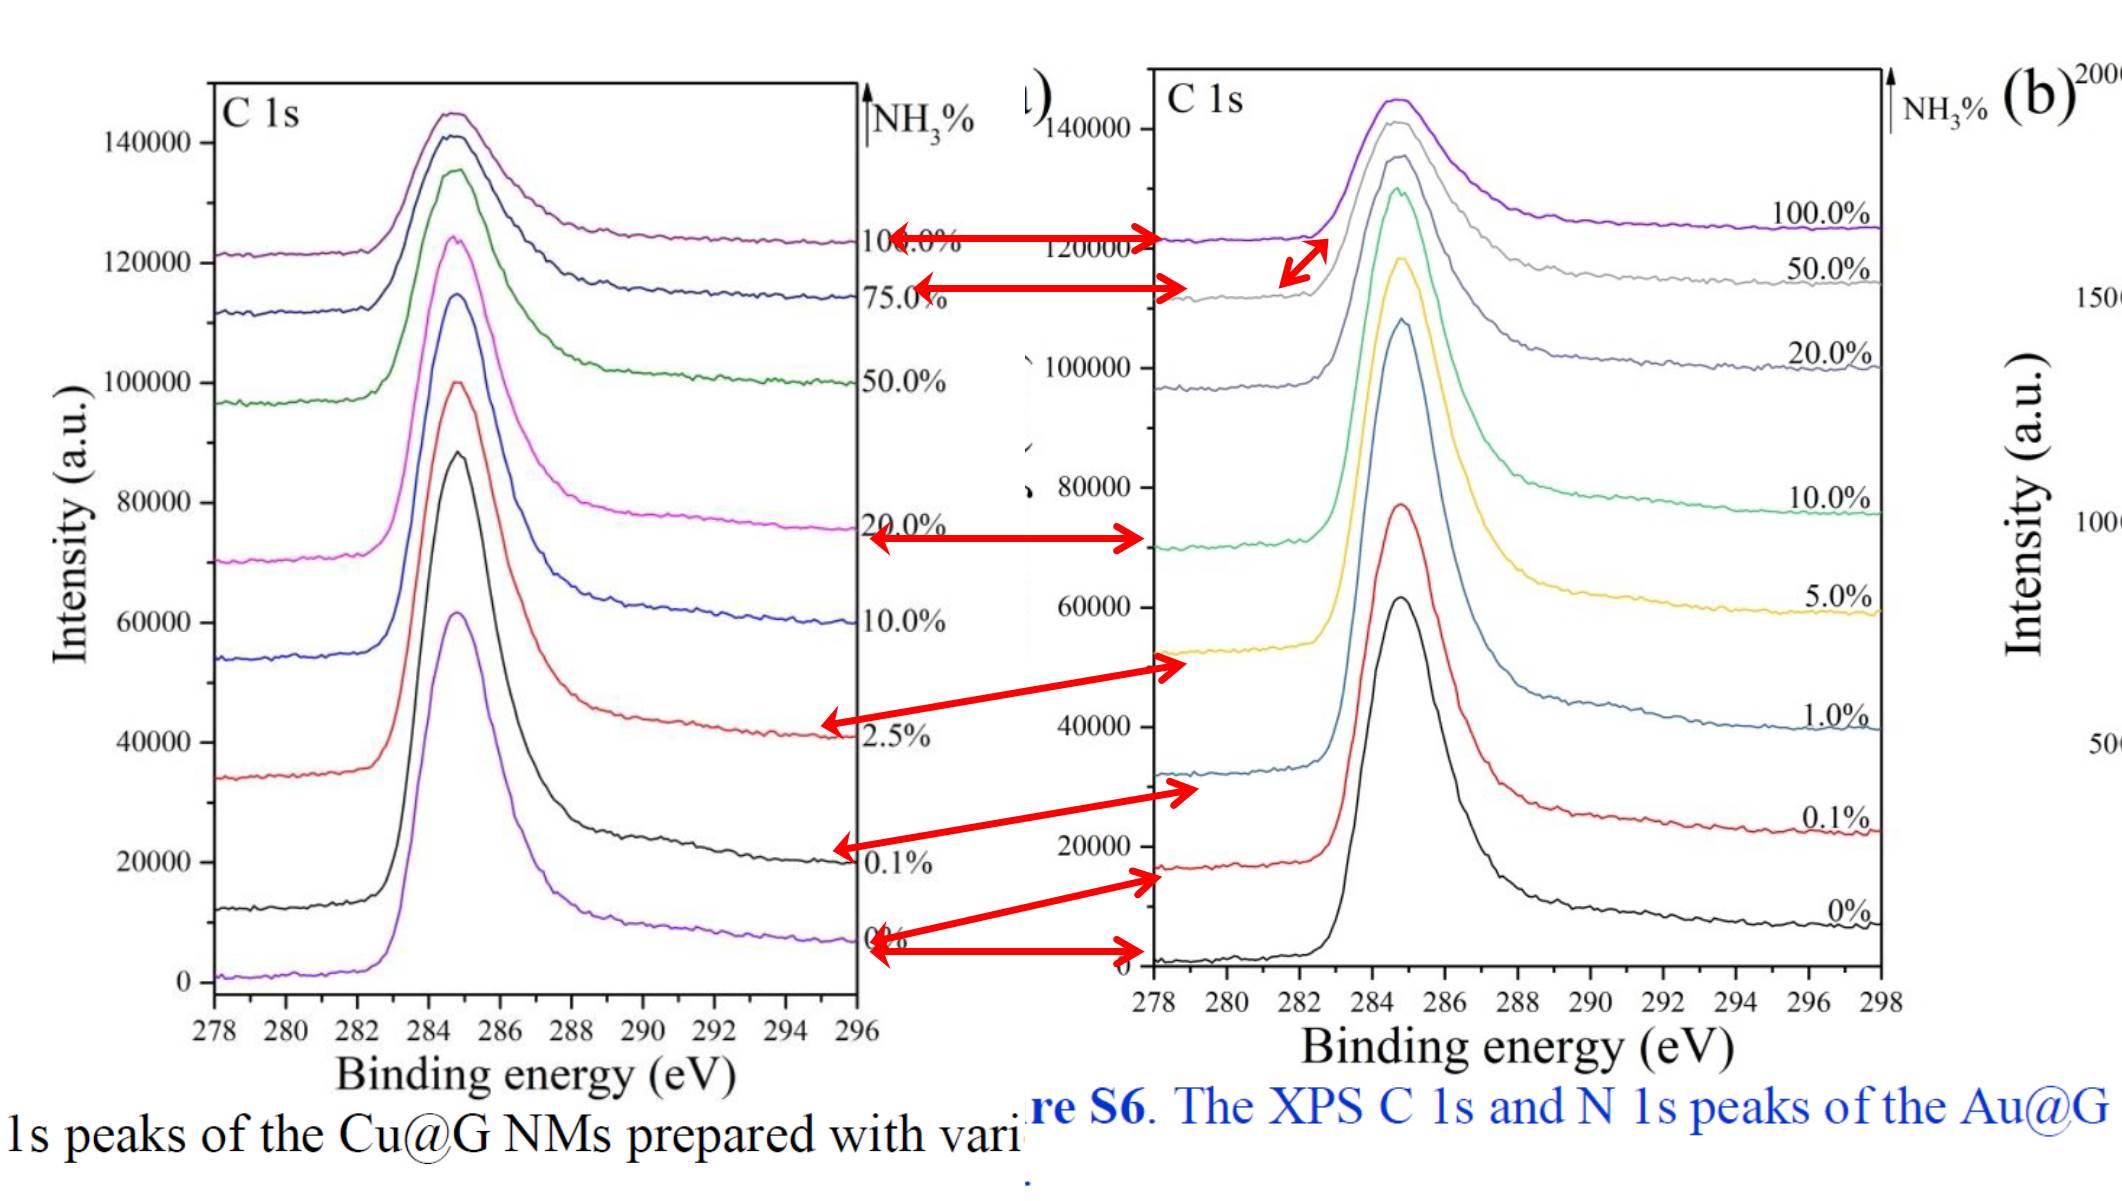
These two are figures are from Advanced Materials Interfaces (2018) IF=4.7 and Advanced Functional Materials (2017) IF =15.6. The noise is relatively weak in these figures but it is sufficient to identify identical spectra for different sets of materials. Two months after publication on PubPeer these papers are not yet corrected, nor have the authors responded.
Of course, I welcome everybody to add more hints to this small manual. Once again, let’s join our efforts in FlashMob #CleanYourScience. Start right now, and don’t stop!

Donate!
If you are interested to support my work, you can leave here a small tip of $5. Or several of small tips, just increase the amount as you like (2x=€10; 5x=€25). Your generous patronage of my journalism, however small it appears to you, will greatly help me with my legal costs.
€5.00


I don’t think there is a problem with the paper from Linköping. The text says:
“The above results demonstrate that PEG-doped BiZn2VO6 samples are successfully obtained, and the crystalline phase of BiZn2VO6 is not affected seriously after loading of PEG. Besides, no additional crystal phases or impurities were observed, implying that the as-synthesized samples are unadulterated.”
So yes, those diffraction patterns are basically identical. As they should be.
LikeLike
Hi Pieter, this is the figure legend again:
“Fig. 2 XRD patterns for ZnO NRs, PEG-doped ZnO NRs, BiVO4, BiZn2VO6, and PEG-doped BiZn2VO6 with different (w/v) percentages of PEG”.
Those are different samples, but with identical spectra, vertically resized.
LikeLike
Hi Leonid, so yes, the top five traces are BiZn2VO6 (pure, and with different percentages of polyethylene glycol, as marked in the legend). PEG is an organic compound, it won’t show in an x-ray diffraction pattern of a crystalline solid with something as heavy as bismuth in it. The intensity is quite arbitrary, nobody would complain if they had been vertically resized. But I guess those were displayed as recorded.
LikeLike
Hi Pieter (and other readers), can you test run the same sample twice and see if the XRD noise patterns remain identical?
LikeLike
As they should be?
LikeLike
Both those traces show a diffraction pattern of the same batch of zink oxide. Also the small detail is expected to be the same.
LikeLike
Mr Kuiper, do you believe in negative intensity of diffraction peaks? The baseline cuts most of the bottom part for these patterns (sorry for that pattern copied 5 times) but not all. Bottom side is also identical
LikeLike
Reply from Mahsa Pirhashemi:
There was a list of references attached. I pointed out that the problem is not the similar, but the identical nature of the spectra, down into the minutest details of the noise. And to other problems with this and another paper from same lab of Omer Nur at LiU:
https://pubpeer.com/publications/181E4A11BD1952C53A8C6152657CF2#2
https://pubpeer.com/publications/39F7A3E772552294D3AC69E147D447#1
Pirhashemi then replied again:
LikeLike
I can save you a lot of time:
“no, it is not possible”.
LikeLike
And let me add: “Not even on the same extra-pure single crystal with the same orientation at the same conditions with the same instrument”
LikeLike
Thank you for a very interesting article. I have been using Google image for searching specific images for duplications, with success, but never tried keyword search like you describe here. Sounds like a powerful tool for more efficient detection of duplications and falsifications.
LikeLike
Don’t forget the biggest fraud buzz-magnet word of all: “cancer”.
LikeLike
Google “cancer” “XRD”, image number 29 on my screen.
https://pubs.rsc.org/en/content/articlehtml/2018/ra/c7ra11763a
Figure 2.
More ideas?
LikeLike
Next found for image number 38:
https://journals.plos.org/plosone/article/figure?id=10.1371/journal.pone.0107315.g001
LikeLike
Leonid, many of the small peaks are not noise. Compare with the powder diffraction data in this paper by Nunes, see the Rietveld fit and the difference trace.
Bismuth zinc vanadate, BiZn2VO6: New crystal structure type and electronic structure
Click to access 16568.pdf
LikeLike
Seems worse than initially thought.
LikeLike
Please look on the bottom side of that noise. It is cut in most of these patterns but not completely. Negative intensity for diffraction peaks?
LikeLike
Leonid, I like your work. I am not related to this group at all, but the argument that Kuipersofsweden makes is that the identical features are not noise, but identical small intensity diffraction peaks, based on the fact that this material does indeed have many such small peaks… This argument should not just be brushed away when accusing somebody of misconduct: yes, diffraction patterns with identical noise are proof of misconduct, but in this case, what you think is noise, may in fact be signal! and then you do expect very similar patterns indeed!
LikeLiked by 1 person
I did ask for expert advice elsewhere. That stuff is indeed bad.
LikeLike
Five identical XRD patterns in one figure was a record which looked hard to beat. Here is new record: Figure with 6 (!) copies of one XRD pattern. I challenge everybody to competition. Will ever be 7 identical spectra/patterens found in one figure ?
LikeLike
Red line looks like the blue and then the rest of the four look like each other…so still fewer than 5 😉 still questionable of course!
LikeLike
As somebody pointed out in twitter the patterns are not exactly identical. But what we see is certainly 6 copies of one pattern with few points added or removed. Modern software allows to remove and to add points with one click. If there are any doubts I can zoom on certain parts to show identical regions.
LikeLike
Today I am searching using “scientific reports” and XRD. Free access journal which takes 2000 $ for publication. In 30 min I spotted 3 papers. That one is most impressive:
https://pubpeer.com/publications/ACE361575DE0F412EDAF3C8D55EFF8
I checked only one figure with XRD. Not sure I spotted all problems. I am puzzled why anyone would pay money to publish that kind of “data”.
LikeLike
More miracles from Scientific Reports
https://pubpeer.com/publications/A5682325ACD10BEC441264C494CA8A#
LikeLike
PLOS One is also easy to search thanks to free access
https://pubpeer.com/publications/3349EF441894E3B27E75296051EC9B
LikeLike
Motivated by this post, I made some 10 minutes of googling, and as a result, made my first discovery of scientific “unexpected similarity in Fig x” (aka “miscond*ct”)
LikeLike
Link to the pubpeer entry: https://pubpeer.com/publications/2726C85778EB63907357B252AC6A87#1
LikeLike
Pingback: Zombie fingers inside corroded nano-piecrusts – For Better Science
Pingback: Linköping haunted by fake spectra – For Better Science
More zombie spectra by Xiangke Wang https://pubpeer.com/publications/59B8367C99DD5A19C94318AF8C89EA
https://pubpeer.com/publications/8835047F33520D23F1D3D8A3F95A6F
Images replicated:
https://pubpeer.com/publications/1FC91FFD46F46A82669500BC8755B6
LikeLike
One more example of figure with 6 copies (slightly modified) of one XRD pattern. My challenge remains: will ever be figure with 7 copies of the same pattern or spectrum found?
https://pubpeer.com/publications/C3A11E81C0C7DF74D063D52FDC5129#1
LikeLike
Pingback: Don’t mess with Fatih Sen – For Better Science
Pingback: Yuqing Zhang’s 10 years of fraud, a whistleblower account – For Better Science
Pingback: Omer Nour and Magnus Willander guilty of research misconduct – For Better Science
Pingback: Erdogan’s academic elites – For Better Science
Pingback: Whitewashed by ACS and Elsevier, Zboril sues Olomouc Dean for “bullying” – For Better Science
Oops. One of Xiangke Wang’s admitted to using Photoshop… before they changed the story. Journal retracted the article anyways. https://pubpeer.com/publications/CC963D5EE7150BC4B6FF5C020BE0E3
LikeLike