
Poor Linköping University. The small, cosy LiU in a small, cosy Swedish town is haunted by yet another possible fraud case. After the May Griffith travesty (unethical human experiments, data manipulation, legal threats against whistleblower and lawsuits) and the Ashutosh Tiwari shitshow (predatory scamferences and research fraud), now the material science lab of Omer Nur is being accused of possible data manipulation. It all started with Fake Spectra Googling #CleanYourScience campaign announced on my site, which brought to light a number of strangely repetitive XRD patterns. It sure is not making things easier that a key co-author on those four papers is another LiU professor, Magnus Willander, a kind of star of material sciences in Sweden and beyond.
Material sciences is a research field with barely any retractions, which, as we all are taught, is an honesty indicator. Praised be our saintly and retraction-free material sciences, a paragon of research integrity, a temple of diligence and honesty, what a pleasant counterpart to all those fraudulent western blots in biomedicine. And yet, after spending just minutes on Fake Spectra Googling, one can find massive fraud. Fake spectra cloned in Photoshop, fake spectra reused across papers, even fake spectra drawn with a pencil, fake spectra reviewed by fake peer reviewers, and nobody cares. In most cases, nothing happens, or hair-raising fraud gets away with a correction, even from such respectable learned societies as ACS and Royal Society of Chemistry. No wonder Tiwari’s scamferences continue unabated, with star participants: material sciences and nanotechnology fields are apparently so rotten that the community doesn’t even bother to act on the worst excesses.
But back to the case at hand. LiU professor Willander boasts to have published 850 papers (obviously he has not read them all), some of these appeared in predatory journals (here), he also occasionally visits predatory conferences (here). Four of Willander’s papers, all with his LiU colleague Nur, were flagged on Pubpeer by the user Thallarcha Lechrioleuca.
There seem to be some problems with the so-called X-Ray diffraction (XRD) spectra the papers by Willander and Nur. XRD technology is applied by material scientists to measure crystals of a given material, the diffraction of X-Rays produces characteristic curves and peaks which the scientists can use for their analysis. As every measurement, XRD measurements produce noise, visible as tiny jitters in the raw data curves. Sometimes however smoothened plots are published, where noise is removed, the curve with its peaks then appears as a smooth featureless line. Noise is random by definition, even measuring same sample twice would produce different noise patterns despite otherwise identical curves.
And yet, and yet…. Just by googling “XRD” in combination with other keywords, Thallarcha Lechrioleuca has been able to spot many un-smoothened XRD plots showing same curves and pixel-identical noise patterns. A whole curve copy-pasted might be a mistake of destitute oversight, but when only parts of two or more different curves are noise-identical, while the rest is different? There is only one scientific explanation for that: data manipulation.
Here is an example:
Azam Khan, Jesper Edberg, Omer Nur, Magnus Willander A novel investigation on carbon nanotube/ZnO, Ag/ZnO and Ag/carbon nanotube/ZnO nanowires junctions for harvesting piezoelectric potential on textile Journal of Applied Physics (2014) doi: 10.1063/1.4890306
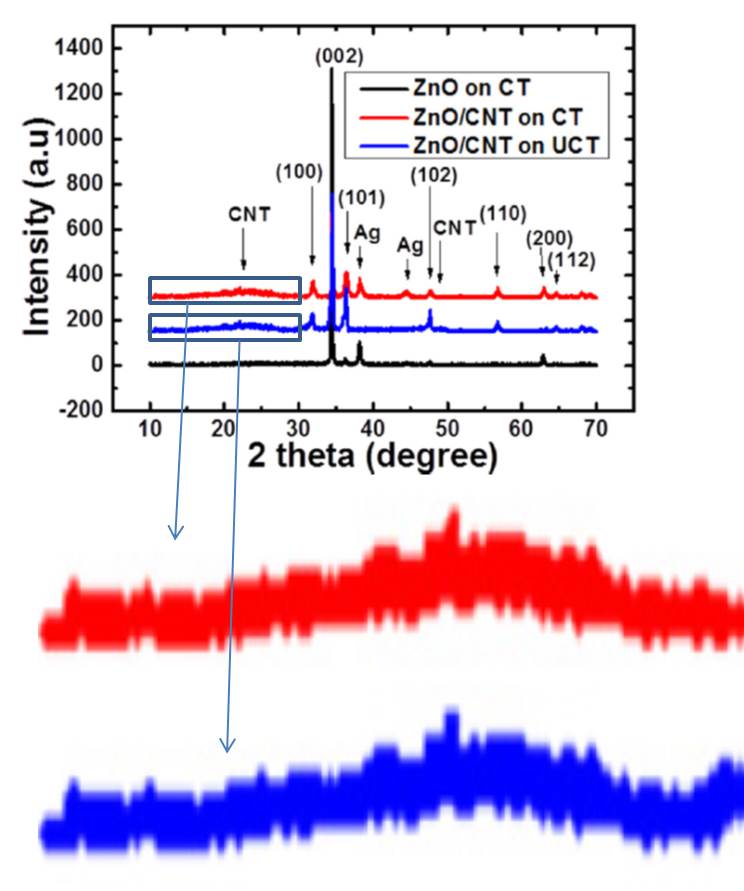
Why are parts of the red and blue XRD spectra so similar, in fact identical, despite that being different, even if related, samples? That PubPeer post set off an intense debate, where Pieter Kuiper and another, anonymous, expert maintained that “Small peaks are not noise, they are diffraction peaks” and that
“PubPeer commenters should familiarize themselves with the techniques before raising questions about a paper.“

So, can such similarities arise by chance when related samples are measured? Another expert, Sylvain Bernes, weighted in with actual experimental data, of a sample placed in XRD diffractometer device and “collected 3 times successively, without dead-time between two data collections“. The noise patterns are clearly different there. Unlike those in Nur and Willander papers, where they are identical, on different samples, mind you.
It got worse.
Mahsa Pirhashemi, Sami Elhag , Aziz Habibi-Yangjeh, Galia Pozina , Magnus Willander , Omer Nur Polyethylene glycol-doped BiZn2VO6 as a high-efficiency solar-light-activated photocatalyst with substantial durability toward photodegradation of organic contaminations RSC Advances (2018) doi: 10.1039/c8ra06896h
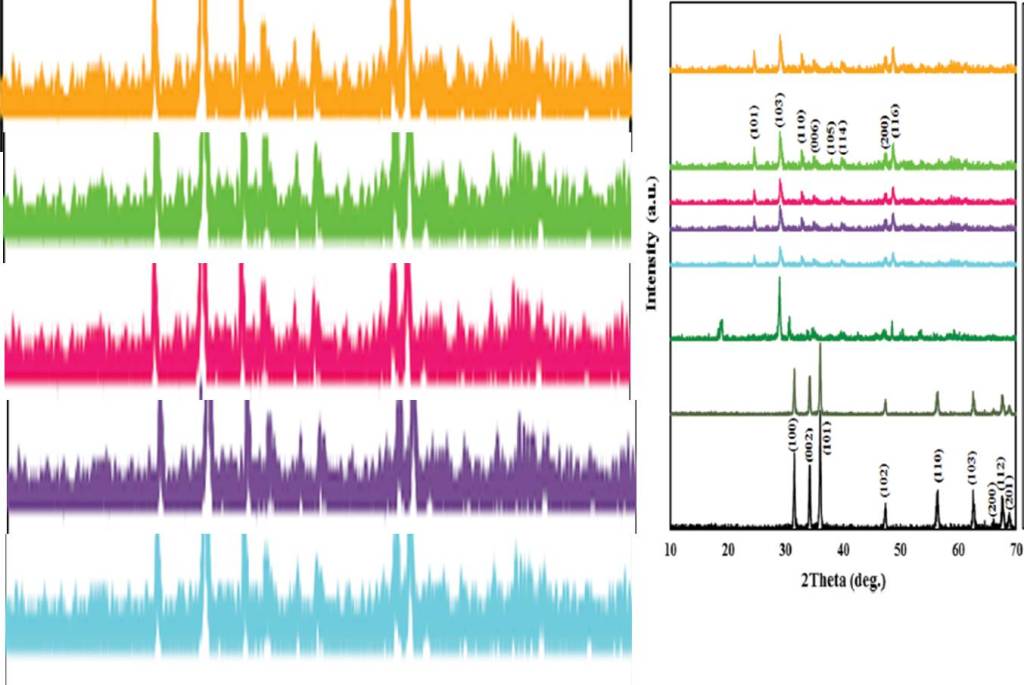
The entire figure seems to be a work of art rather than of science. The first author Mahsa Pirhashemi wrote me an email, explaining the experiments and concluding:
“in this study we fabricated the five sample of BiZn2VO6 particles with and without the PEG addition, because of this we have the same XRD patterns with different intensities.
Furthermore, we can have the same issue in FT-IR results for different percentage of one component in composite materials. It is clear that for different percentage of component, we have similar FT-IR spectra, because the nature and kind of materials in the all composite is the same.”
I wrote back, clarifying that the issue was not the similar, but the identical nature of the stretches of XRD spectra in the Figure 2. Pirhashemi replied back:
“All the XRD patterns were measured by a Philips PW 1729 with Cu Kα radiation source. This instrument is too old and I remember that we analyzed all samples in the same day! I think maybe there is an error coming from instrument. It is noted that the main intensity of each pattern is very low if have compared with the other references, which cause on determined noise more clearly. It can be observed on different paper of LiU university that was applied this XRD machines. Also there is a common way to reduce the noise by using various XRD softwares, which the many references mostly use.
To persuade you I can synthesize the nanocomponents and take the XRD patterns with another instrument again.“
Strange, the data was merely a year old, and now it is being discarded just like this, the entire experiment to be repeated. I suggested to check the raw data files anyway, Pirhashimi didn’t reply anymore. Maybe that naughty old Philips PW 1729 ate it?
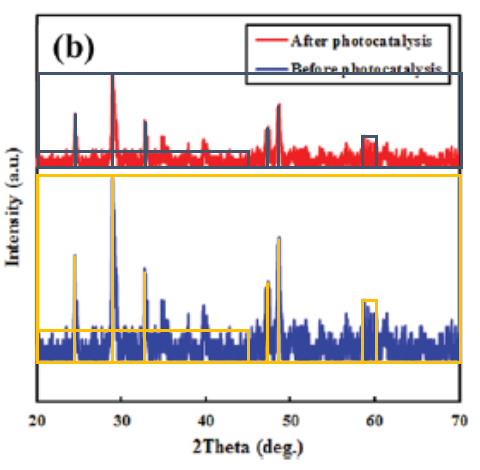
There is even more wrong in that paper. Figure 13b (right) turned out to display many identical patterns between two different analyses, all one needed to visualise it was some re-scaling. An innocent mistake?
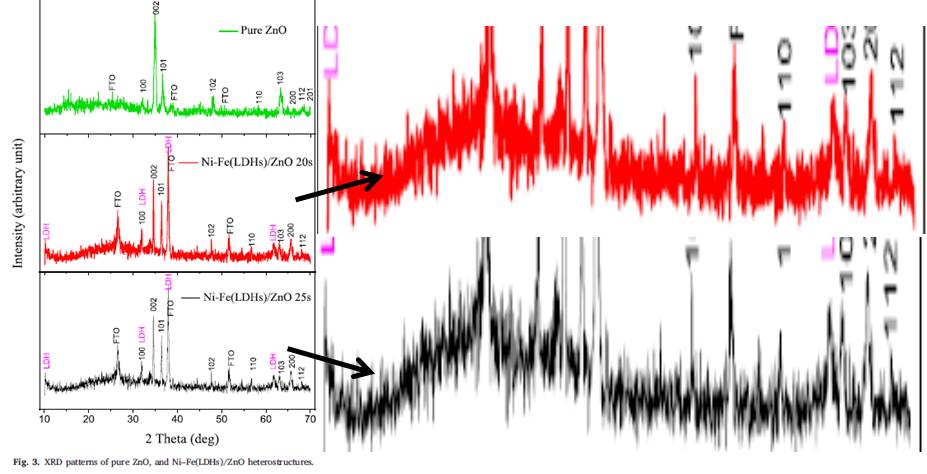
Also in another recent paper by Nur and Willander, two XRD patterns were reported to be identical:
Elfatih Mustafa , Aneela Tahira, Rania E. Adam, Zafar Hussain Ibupoto, Sami Elhag, Magnus Willander , Omer Nur Efficient Ni–Fe layered double hydroxides/ZnO nanostructures for photochemical water splitting Journal of Solid State Chemistry (2019) doi: 10.1016/j.jssc.2019.03.004
It is reasonable to expect of Nur and Willander to have the original raw data stored somewhere. Surely it was not stored on a laptop which happened to have been stolen on a ferry scamference, like in Tiwari’s case? The oldest paper among the four is not even 6 years old:
Mushtaque Hussain , Zafar Hussain Ibupoto , Mazhar Ali Abbasi , Omer Nur, Magnus Willander Effect of anions on the morphology of Co3O4 nanostructures grown by hydrothermal method and their pH sensing application Journal of Electroanalytical Chemistry (2014) doi: 10.1016/j.jelechem.2014.01.011
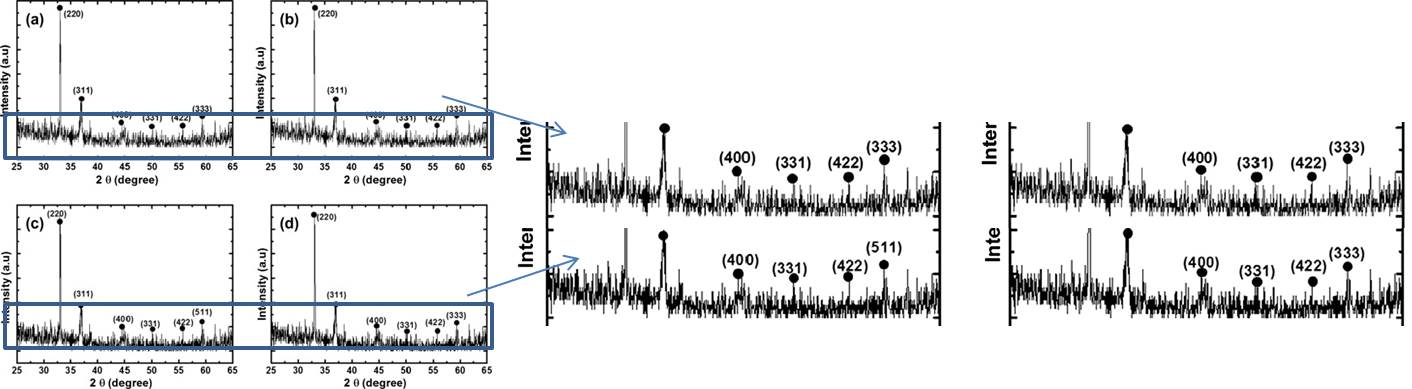
XRD patterns on the upper panels are identical to lower panels.”
The dean of the LiU Faculty of Science and engineering, Ulf Nilsson, informed me that the case has been forwarded to the Research Misconduct Board, a national authority newly formed in the wake of the Paolo Macchiarini affair at the Karolinska Institutet. The board is comprised by two judges as well as representatives of the larger Swedish universities (one member each, including LiU), it started work on 1 January 2020 with its first case of the former Karolinska rector, Karin Dahlman-Wright. I am honoured to keep the board busy.

Donate!
If you are interested to support my work, you can leave here a small tip of $5. Or several of small tips, just increase the amount as you like (2x=€10; 5x=€25). Your generous patronage of my journalism will be most appreciated!
€5.00


For the sake of correctness: The data presented are not XRD spectra but XRD patterns. XRD is a scattering and not spectroscopic technique, something that a many colleagues seem to forget 😉
LikeLike
Pingback: Don’t mess with Fatih Sen – For Better Science
Pingback: Omer Nour and Magnus Willander guilty of research misconduct – For Better Science