
“The National Board for Assessment of Research Misconduct (the Board) decides that Mazhar Ali Abbasi, Rania Elhadi Adam. Jesper Edberg, Sami Elhag, Mushtaque Hussain, Zafar Hussain Ibupoto, Azam Khan, Elfatih Mustafa Omer Nour, Mahsa Pirhashemi, Galia Pozina, Aneela Tahira and Magnus Will Anderson are guilty of misconduct in research in the articles below. “
This is a quote from a fresh decision letter of a Swedish misconduct investigation: Two professors at Linköping University (LiU), Omer Nur and Magnus Willander, have been found guilty of research misconduct, by the new central authority, the National Board for Assessment of Research Misconduct (NPOF). The evidence of the as “fabricated” certified nanotechnology research was posted on PubPeer by a reader of my site (Thallarcha Lechrioleuca), as part of his with Fake Spectra Googling #CleanYourScience campaign, where one of Nur-Willander papers cropped up. In November 2019, I notified the dean of the LiU Faculty of Science and engineering, Ulf Nilsson, and published the follow-up story in March 2020. Nilsson initiated an investigation, which ended in thsi NPOF verdict.
NPOF was founded by the Swedish politics and universities in the aftermath of the Paolo Macchiarini affair at the Karolinska Institutet. The Board publishes its misconduct findings online, with names of the offenders symbolically blackened (their papers are listed though, with names of the person under investigation highlighted in black). Among them is the high-profile scandal I caused with the help of my readers: that of the former Karolinska rector, Karin Dahlman-Wright, whom NPOF found guilty of research misconduct after its predessor, the central ethics review board (CEPN) tried its best to save that ex-member of the Nobel Prize Committee. I am a big fan of this new NPOF, I must admit.

As the notifier in this current Nur-Willander case, NPOF provided me with the decision letter and then with investigative reports which I share below. The impressive thing: it would have been too easy to blame some junior researchers alone, all of them foreigners. Probably every single national authority, certainly the ORI in USA, would have done that, while whitewashing the professors as victims of scheming students or postdocs. But not the Swedish NPOF: every one of the LiU-affiliated authors gets the same responsibility (NPOF explicitly did not judge on those coauthors without a Swedish affiliation).
It is already the second research misconduct case I reported to LiU and the third LiU case I cover on my site. First there was of course the Ashutosh Tiwari shitshow (predatory scamferences and research fraud), which ended up with research misconduct findings for Tiwari and his patron Tony Turner. Turner was sent off into early retirement and Tiwari’s dream of becoming LiU professor ended with him leaving the town altogether, now scamferencing from a tiny village 40 km away from Linköping. I also covered the May Griffith travesty (unethical human experiments, data manipulation, legal threats against whistleblower and lawsuits), who once tried to bribe me with €400 and is now doing her thing under personal protection of the rector of University of Montreal. Both Tiwari and Griffith happened in the same faculty and even same department led by Nilsson, who now had to investigate yet another affair.

So now the misconduct findings hit the LiU associate professor Nur (sometimes spelled as Nour), who did his PhD under Willander at LiU in 1990-1996, also guilty is his former mentor, presently professor emeritus at LiU. When Willander moved to the Chalmers University in Gothenburg, the freshly graduated Nur followed; when Willander returned to LiU in 2006, Nur returned as well. This suggests, Willander is not exactly a hapless and naive victim of Nur’s misconduct here.
Willander built a huge reputation in materials science and published over 1000 publications in his career (did he even read them all?), some of these appeared in predatory journals (here). He is also content with occasionally visiting predatory conferences (here), Willander even proudly listed those, like Chinese BitCongress gigs, in his LiU faculty profile. The four papers with Nur earned him fraud findings, what a way to conclude a magnificent academic career. Now that his mentor retired, Nur might find it difficult to obtain a full professorship at LiU, what with the misconduct findings against them both. He might even be invited to explore some new career opportunities!

What broke such a beautiful academic dynasty at LiU, were some fake X-Ray diffraction (XRD) spectra Willander and Nur published together. XRD technology is applied by material scientists to measure crystals of a given material, the diffraction of X-Rays produces characteristic curves and peaks which the scientists can use for their analysis. As every measurement, XRD measurements produce noise, visible as tiny jitters in the raw data curves. Sometimes however smoothened plots are published, where noise is removed, the curve with its peaks then appears as a smooth featureless line. Noise is random by definition, even measuring same sample twice would produce different noise patterns despite otherwise identical curves. But the noise in the 4 papers reported on PubPeer and investigated by NPOF was identical into the tiniest detail.
This now is the NPOF decision letter, also for download:
Quote:
“An internal expert 1 at Linköping University analysed the raw data for Article 1. For Articles 2-4, raw data could not be located and only the graphs were examined therefore.
The board has obtained an external expert opinion in the case. The expert 2 has been given access to all documents in the case, including raw data for the notified figures in Articles 1, 3 and 4 (for Article 2 , raw data was still missing).
Those notified have been given the opportunity to comment on the matter. Research team leader Omer Nur has delivered an opinion to the board and wrote on behalf of all authors regarding the four notified Articles to deny the allegations of research misconduct.”
The experts were:
1 Jens Birch, Professor at the Department of Physics, Chemistry and Biology, Linköping University.
2 Magnus Skoglundh, Professor at the Department of Chemistry and Chemical Engineering, Chalmers University
These were the papers they investigated:
Paper 1
Mahsa Pirhashemi, Sami Elhag , Aziz Habibi-Yangjeh, Galia Pozina , Magnus Willander , Omer Nur Polyethylene glycol-doped BiZn2VO6 as a high-efficiency solar-light-activated photocatalyst with substantial durability toward photodegradation of organic contaminations RSC Advances (2018) doi: 10.1039/c8ra06896h
This entire Figure 2 proved fabricated. Maybe this was what the first author Mahsa Pirhashemi tried to convey in her email from November 2019 to me:
“in this study we fabricated the five sample of BiZn2VO6 particles with and without the PEG addition, because of this we have the same XRD patterns with different intensities. Furthermore, we can have the same issue in FT-IR results for different percentage of one component in composite materials. It is clear that for different percentage of component, we have similar FT-IR spectra, because the nature and kind of materials in the all composite is the same.”
Fabricated is the code word! Pirhashemi later blamed the “Philips PW 1729 with Cu Kα radiation source” for first manipulating, then destroying the raw data. Birch however disagreed with this theory, when he wrote to Ulf Nillson in January 2020:
“In addition to the fact that it is absolutely clear that it is identical raw data that is behind the 5 top diffractograms in Figure 2, all I can say is that all data files with RD file extensions except one (“ZnO.RD”) that you attached have clearly been manipulated. I can see this by the fact that the number of counted X-ray quantities in each data point is not registered as an integer. The number of X-ray quantities is of course always integer values (think a crack from a Geiger meter).“
The external expert Skoglundh later confirmed Birch’s initial assessment:
“Since the X-ray diffractograms for the five different Bi2ZnVO6samples in Figure 2 of Article [1] are identical (in terms of position and relative intensity between the diffraction peaks for each sample, absolute intensity for one and the same peak for the different samples multiplied by a factor of 1.3 and 1.9 and, above all, with respect to noise) they can not come from five different measurements. Therefore, at least four of the top five X-ray diffractograms in Figure 2 must be fabricated.”
The NPOF reports narrates what happened next:
“In an additional expert opinion, the expert hired by the Panel analysed the raw data of Figure 2 and 13b in Article 1 which Omer Nour provided to the board. The expert [Skoglundh] notes that raw data files do not match the plotted graphs. The expert’s previous findings, that at least four of the five top X-ray diffractograms in Figure 2 are fabricated and to at least one of the two X-ray diffractograms in Figure 13b is fabricated, remains standing.
The external expert Skoglundh concluded in his final, additional report on this paper from October 2020:
“Since the X-ray diffractograms for the five different BiZn2VO6samples in Figure 2 of Article [1] are identical (in terms of position and relative intensity between the diffraction peaks for each sample, absolute intensity for one and the same peak for the different samples divided by a scaling factor, but above all, with respect to noise) they can not come from five different X-ray diffraction measurements. After careful comparison with the raw data in the files BiZn2VO6.RD, 0.01.RD, 0.05.RD, 0.1.RD and 0.15.RD, my conclusion is that the raw data in BiZn2VO6.RD has been used to plot one of the X-ray diffractograms (BiZn2VO6), in Figure 2 of Article [1]. However, the raw data in the files 0.01.RD, 0.05.RD, 0.1.RD and 0.15.RD was however not used to plot X-ray diffractograms in Figure 2. After careful comparison with the data in the files BiZn2VO6.csv, 0.01.csv, 0.05.csv, 0.1.csv and 0.15.csv, I can state that the five X-ray diffractograms (BiZn2VO6, 0 .01% PEG-doped BiZn2VO6, 0.05% PEG-doped BiZn2VO6, 0.10% PEG-doped BiZn2VO6 and 0.15% PEG-doped BiZn2VO6) in Figure 2 in article [1] are plotted with the data in these five csv files. The same diffraction data as in the file BiZn2VO6.csv but multiplied by the respective scaling factor (1,333, 1,360, 2,000, and 2,200) has been used to obtain the diffraction data in the files: 0.01.csv, 0.05.csv, 0.10.csv, and 0.15.csv. The data in these four files is fabricated. Therefore, at least four of the top five X-ray diffractograms in Figure 2 of Article [1] are fabricated.“
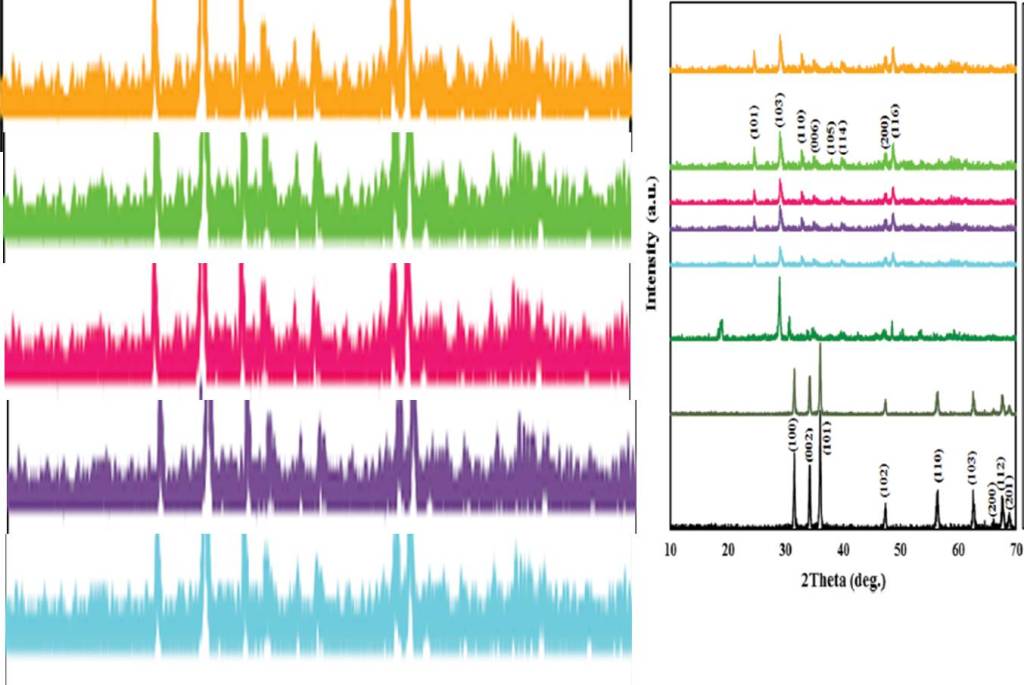
Also Figure 13b was fake:
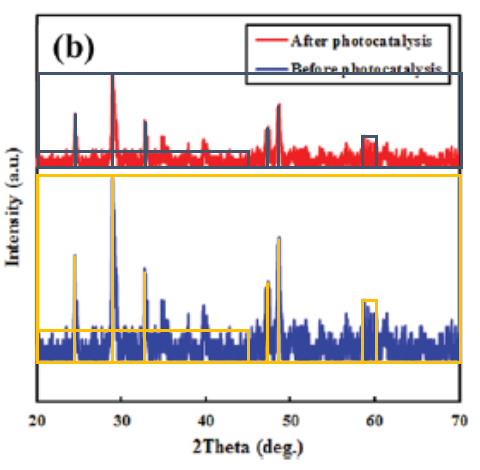
Skoglundh concluded in his analysis for Figure 13b:
“Since the X-ray diffractograms of the BiZn2VO6sample before and after the photocatalysis experiment in Figure 13b in Article [1] are identical (in terms of position and relative intensity between the diffraction peaks for the two samples, absolute intensity for one and the same peak for the two the samples divided by a scaling factor and, above all, with respect to noise) they can not come from two different X-ray diffraction measurements. After careful comparison with the raw data in the files 0.1.RD and Recycling.RD, my conclusion is that the raw data in Recycling.RD has been used to plot the X-ray diffractogram “After photocatalysis” in Figure 13b in Article [1]. However, the raw data in file 0.1.RD has not been used to plot the second X-ray diffractogram in Figure 13b. After careful comparison with the data in the files 0.1.csv and Recycling.csv, I can state that the two X-ray diffractograms (Before photocatalysis and After photocatalysis) in Figure 13b in Article [1] are plotted with the data in these two csv files. The same diffraction data as in the file Recycling.csv but multiplied by the scaling factor 1.667 has been used to obtain the diffraction data in the file 0.1.csv. The data in this file is fabricated. Therefore, at least one of the X-ray diffractograms in Figure 13b of Article [1] is fabricated.”
In simple words: the authors took one dataset, copy-pasted it twice (Fig 13b) or even 5 times (Fig 2), while multiplying it by different scaling factors, and labelled it as different samples. This is plain research fraud. Will the paper be retracted now?
Paper 2
Azam Khan, Jesper Edberg, Omer Nur, Magnus Willander A novel investigation on carbon nanotube/ZnO, Ag/ZnO and Ag/carbon nanotube/ZnO nanowires junctions for harvesting piezoelectric potential on textile Journal of Applied Physics (2014) doi: 10.1063/1.4890306
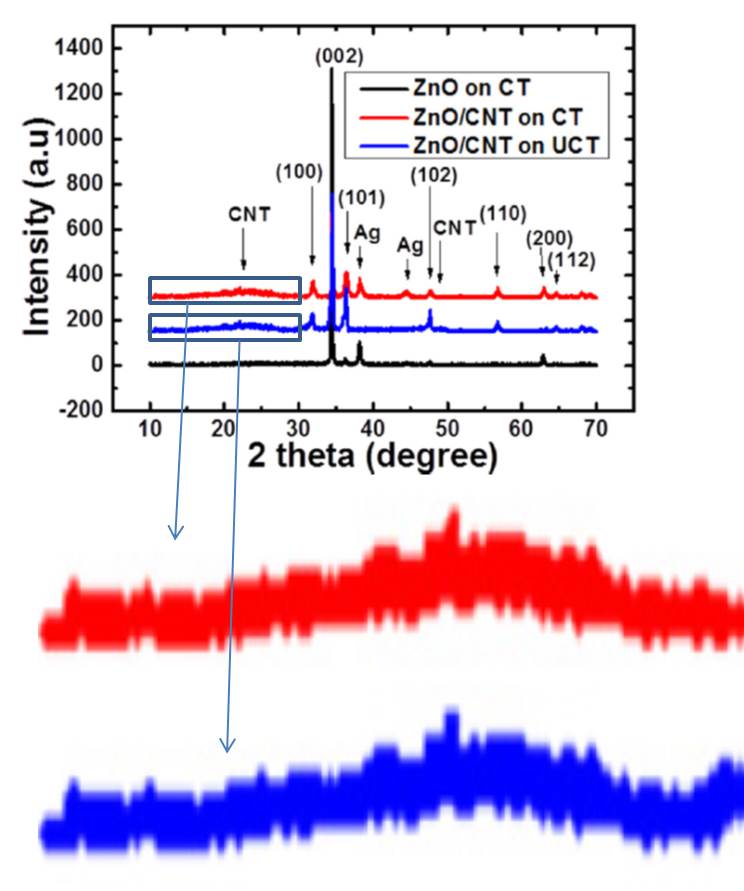
Obviously, this is not just some copy-paste with rescaling. The XRD spectra are identical only in certain parts, and diverge in others. Birch opined in an email to Nilsson:
“The noise is stochastic in nature (Poisson-distributed) and is never the same in two measurements – even if you did them on the same test one after the other. This was probably the same conclusion you came to. In other words, the authors must have cut together at least two data files to get one of those diffractograms.
The reason can be speculated about. For example, that for some reason they did not measure the entire angular range on one of the samples but want (or are asked by the reviewer) to show that there are / are no unforeseen peaks there.”
Skoglundh concluded:
“Since the X-ray diffractograms of the two samples ZnO NW on CNT-UCT and ZnO NW on CNT-CT in Figure 4 of Article [2] contain significant ranges that are identical (in terms of position and relative intensity between the diffraction peaks of the two samples, absolute intensity for one and the same peak for the two samples and, above all, with respect to noise) they can not come from two different measurements. At least one of these X-ray diffractograms must therefore be fabricated.”
Paper 3
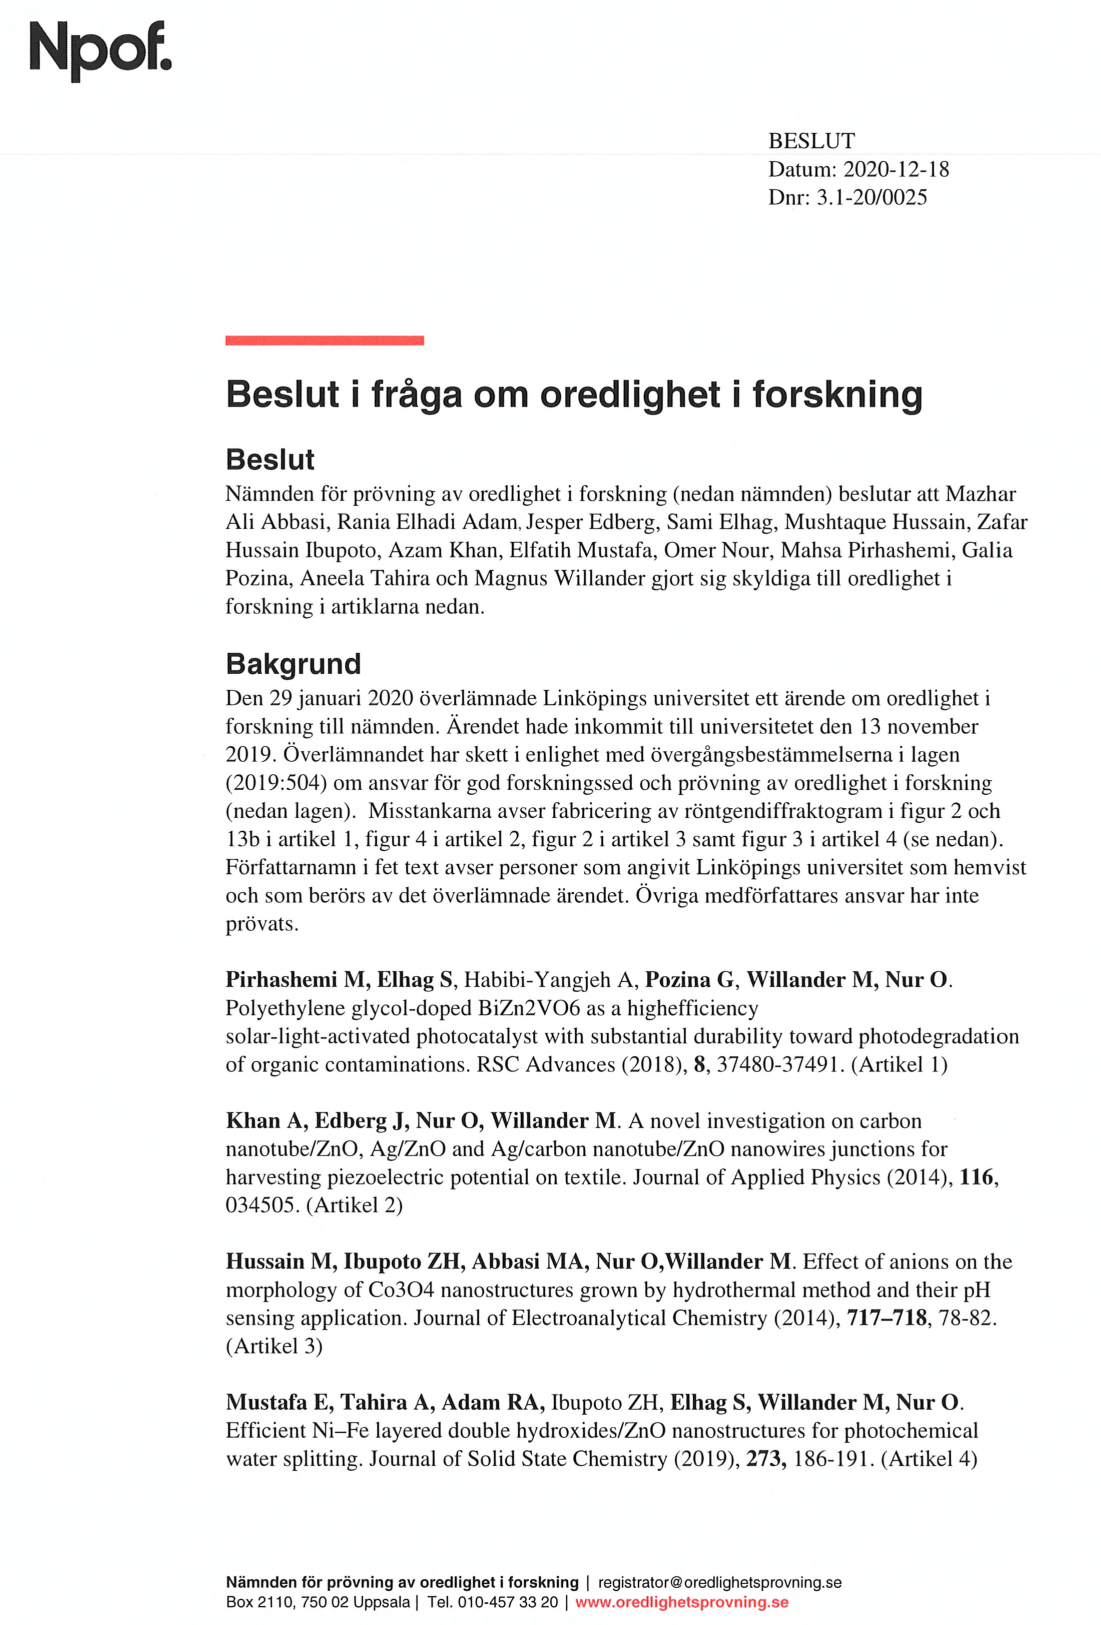
Mushtaque Hussain , Zafar Hussain Ibupoto , Mazhar Ali Abbasi , Omer Nur, Magnus Willander Effect of anions on the morphology of Co3O4 nanostructures grown by hydrothermal method and their pH sensing application Journal of Electroanalytical Chemistry (2014) doi: 10.1016/j.jelechem.2014.01.011
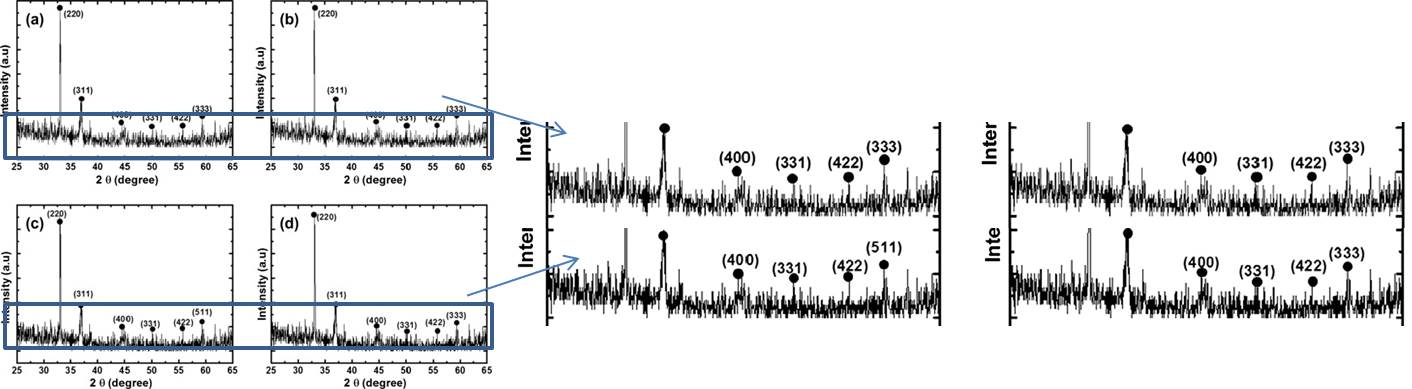
XRD patterns on the upper panels are identical to lower panels.”
Four highly similar XRD spectra. Birch commented:
“My assessment is that identical measurements are the basis for the two diffractograms. This is again based on the fact that the noise in XRD always follows Poisson statistics and is thus stochastic. The two lowest graphs in Figure 3 have identical noise. The difference that is visible between the graphs is entirely due to the fact that they are plotted with slightly different line thicknesses.”
Skoglundh concluded:
“Since the X-ray diffractograms for the four different cobalt oxide samples in Figure 2 in Article [3] are identical (in terms of position and relative intensity between the diffraction peaks for each sample, absolute intensity for one and the same peak for the four different samples and, above all) , with respect to noise) they can not come from four different measurements. Therefore, at least three of the X-ray diffractograms in Figure 2 must be fabricated.“
In this case, I predict a correction, since that work of “fabrication” was published with Elsevier. Why? Because of Paper 4:
Paper 4
Elfatih Mustafa , Aneela Tahira, Rania E. Adam, Zafar Hussain Ibupoto, Sami Elhag, Magnus Willander , Omer Nur Efficient Ni–Fe layered double hydroxides/ZnO nanostructures for photochemical water splitting Journal of Solid State Chemistry (2019) doi: 10.1016/j.jssc.2019.03.004
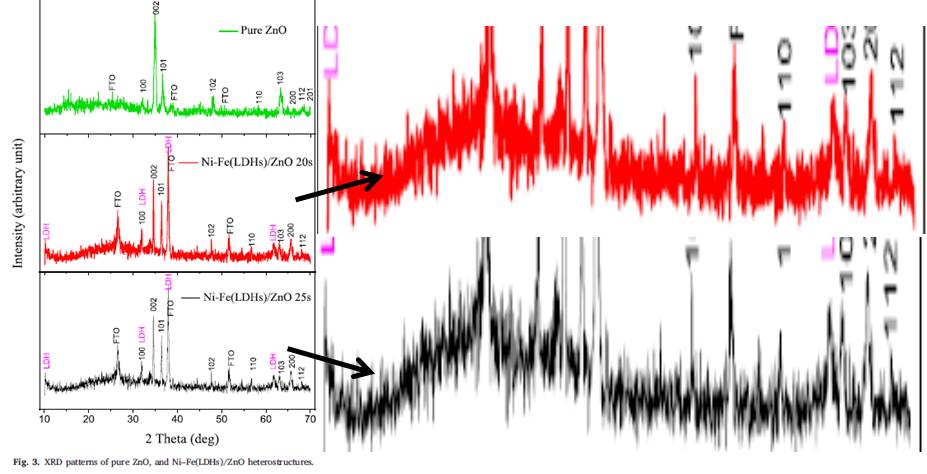
Birch commented already in January 2020:
“My assessment is that it is identical measurements that form the basis for the four diffractograms. any visual anomalies are due to the resolution of the plot / printer / scanner. So my conclusions are broadly in line with the accusations leveled at PubPeer.“
But nevertheless, the paper was later corrected by Elsevier, on 9 October 2020:
“The authors regret that Figure 3 was incorrect in the published article. In the figure one of the spectrums for the sample called Ni–Fe(LDHs)/ZnO 20s was plotted with the same data as the third sample Ni–Fe(LDHs)/ZnO 25s. This error happened because the two spectra are very similar. […]
Authors would like to mention that this change will neither affect the findings nor the conclusion in the paper.”
Now, here Skoglundh was provided with this same replacement file which Elsevier declared to be the original raw data, by the first author Elfatih Mustafa who apaprently insisted that the spectra just look similar.

Skoglundh’s conclusion is very different from that of Elsevier, he says the data is “fabricated”:
“Since the X-ray diffractograms of the two different Ni-Fe (LDH) on the ZnO samples in Figure 3 in Article [4] are identical (in terms of position and relative intensity between the diffraction peaks for the two samples, absolute intensity for one and the same peak for the two samples multiplied by a factor of 1.1 and, above all, with respect to noise) they can not come from two different measurements. At least one of these X-ray diffractograms must therefore be fabricated.”
Omer Nur: results and conclusions not affected!
The NPOF letter sums up:
“The expert [Skoglundh] believes that it is enough to analyse the graphs in the Articles in order to draw conclusions. He concludes that the two notified figures in Article 1, and each reported figure of Article 2-4 contains fabricated X-ray diffractograms.
He writes that in Article 1, at least four of the five top X-ray diffractograms in Figure 2 are fabricated, and so is at least one of the two diffractograms in Figure 13b. In Article 2, at least one of the two top X-ray diffractograms in Figure 4 is fabricated as they contain significant identical areas. In Article 3, at least three of the four X-ray diffractograms in Figure 2 are fabricated. In Article 4, at least one of the two lowest X-ray diffractograms in Figure 3 is fabricated.
Omer Nour pointed out that the by the board hired expert did not appear to have analysed the raw data for the articles where such had been provided and that an analysis of the raw data is necessary for a fair assessment. In his opinion Omer Nour admits however, that the same sample was plotted several times during the preparation of the figures for two of the articles (Articles 3 and 4). He writes that this is due to mistakes and that the confusion of data does not affect the articles’ results or conclusions. In Figure 2 and 13b of Article 1, he believes that there are technical and scientific explanations for the similarities in X-ray diffractograms and for Figure 4 of article 2, he confided that there are two points in X-ray diffractograms that are not completely identical.”
Those differences do prove something, dear Dr Nour, but not what you aim to prove. Rather, those fakeries you defend are actually even nastier than simply copy-pasting and rescaling of spectra. These are Frankenstein XRD spectra, made from bits and pieces, shouldn’t you have learned it better under your mentor Willander? The NPOF decision letter continues:
“Those notified were given the opportunity to comment on the additional expert opinion and Omer Nour spoke on behalf of all authors. He does not agree with the expert, but beyond that it does involve not research misconduct, but rather a misunderstanding that could have been avoided if they had contributed more detailed explanation / data in the article.
The Board makes the same assessment as the experts and finds that it has been clarified that the four articles contain fabricated X-ray diffractograms. The Board notes also that the original data Article 2 does not seem to have handled and archived in a proper way.”
Oh NPOF. Didn’t they read the Elsevier’s decree that there never was any misconduct and that the conclusions are never affected? So what that the figures contain fabricated data, so what that the raw data from brand new papers is missing or does not show what the published figures show?
NPOF reports ends with
“The Board assesses that there are no scientifically acceptable explanations for why the notified researchers have fabricated research results in the manner that has occurred in the notified articles. Raw data also does not support the reported results. The question arises whether that was a case of omission, negligence or misunderstanding. Against this background, the Board considers that the notified scientists in any case acted with gross negligence.
In summary , the Board finds therefore that the notified researchers have been guilty of misconduct in research.”

Donate!
If you are interested to support my work, you can leave here a small tip of $5. Or several of small tips, just increase the amount as you like (2x=€10; 5x=€25). Your generous patronage of my journalism will be most appreciated!
€5.00


Fantastic work, Leonid and Thallarcha for pursuing these concerns despite push back from authors.
“Pieter Kuiper commented a year ago:
Thallarcha Lechrioleuca clearly has no experience with x-ray powder diffraction. The difference at higher angles is due to the presence of silver. The lower-angle range is then due to the carbon nanotubes. Small peaks are not noise, they are diffraction peaks. When one uses the same batch of nanotubes one expects a very high degree of similarity.”
LikeLiked by 1 person
Same x-ray powder diffraction figures in different papers said to correspond to different (impossible) compounds were recently evidenced at PubPeer :
https://pubpeer.com/publications/6FB8D15B22C3F3B234E36D60BF0B31
https://pubpeer.com/search?q=mishra
LikeLike
Good job by Sweden. Sad that other zombie spectra were not investigated like that. No retractions after last year attempt to start “#CleanYourScience” even for the most spectacular cases.
LikeLike
Pingback: Riepilogo - Ocasapiens - Blog - Repubblica.it
It has proven itself a mistake to import students from developing countries like India and Pakistan to the EU and let them grow for professional maturity, without being aware that truth is very relative in their culture. They come from a corrupt chaos and instead of adapt to a non-corrupt and non-chaotic research environment, they brought with themselves corruption and chaos.
LikeLike
What a brilliant example of Xenophobic and discriminatory statement.
LikeLike
no, it is the core conflict between the universalism (truth is objective) and particularism (truth is relative). universalism embraces diversity, and by doing so, permits the destruction of its on values. or do you think your diversity would be tolerated in any of those countries which have a particularistic culture? such as Pakistan and India? if so, go ahead.
LikeLike
do you think your diversity would be tolerated
“Diversity”? This is a straw-man waving a red herring while riding a hobby-horse.
LikeLike
Agreeing with Osiander on this.
LikeLike
yes, this is the freedom of speech and the diversity of opinions. I love actually when people give lessons about diversity from their tablets in their cozy-comfy middle class houses
LikeLike
Who’s “giving lessons on diversity”? You seem to be replying to arguments that no-one has made in comments that no-one can see. Because of the invisibility of those comments, it’s hard to judge the cogency and relevance of your responses.
LikeLike
If all the problems in EU research are introduced by students coming in from cultures of corruption and chaos and relative truth, I don’t know where this puts collaborations with the US.
LikeLike
yes, one portion of the problems is surely imported by those fellows.
LikeLike
The problem here is related to curricullum. When comparing a physcis bachelor in China or India (5 years) with one within in Bologna system the first one clearly won. The background is much stronger because of competition and the posiblity of failing (exams). The passing level there is 70 % or less while here on Europe is bigger then 95%. I am having a EU student now asw PHD. He never heard of Young double slits experiment. However, he graduated with laudae. Regarding the chaos in India. Willander is Swedish and hence comming from a country where Julia claims there is not chaos or corruption. Moreover, if you follow this blog you can see a lot of European/US people guilty of serious misconducting. Judging a nation by the action of one is indeed xenophobism
LikeLike
Posting an individual’s CV with their personal information on the internet is such a shitty thing to do. Shame on you
LikeLike
Shame on Prof Nur then. And on you for saying such mean things to him.
https://www.academia.edu/1406404/OmerNur_CV_February_2012
LikeLike