
In June 2023, Maarten van Kampen published his analysis of the mysteriously duplicated numbers inside the raw data in the papers by two neuroscience professors at Stanford University: Thomas Südhof, laureate of the 2013 Nobel Prize in Physiology or Medicine, and his wife Lu Chen.
It turned out that the raw data published as supplemental material was actually not raw data at all: it was created post-hoc, when the manuscript was submitted for publication. Hence, when the authors were caught with forged replacement data to fix the duplications, this was not relevant for the traditionally unaffected conclusions, and Südhof declared:
“Yup we are being hounded.”
Still, Chen’s paper recently received a mega-correction for what she insisted were “careless but honest mistakes“, and Südhof was about to correct his lab’s paper, but the mounting evidence of fraud apparently got him to reconsider. A retraction is likely.
For backstory, read this earlier article by Maarten.

Science moves forward with productive and meaningful activities
“Yup we are being hounded.” – Thomas Südhof
And now, his second attempt at hounding.
A second attempt at bookkeeping
By Maarten van Kampen
In an earlier ‘Bookkeeping’ post I dissected two publications from the labs of Lu Chen and Thomas C. Südhof. Both papers were flagged on PubPeer for potential duplications in their underlying data, showing surprisingly large numbers of values repeating in- or between conditions.

The authors’ initial reaction to these concerns was rather surprising. The first author of the Südhof paper responded by mostly acknowledging the issues and providing fabricated replacement data. Lu Chen acknowledged the first concern, but rejected the second by providing impossible original data which I now deem likely to have been fabricated as well.
In the four months since the initial For Better Science post both groups have prepared corrections. The correction for the Lu Chen paper has been published, the one for the Südhof paper is announced. Here I want to shortly discuss the former and give my expectations of the latter.
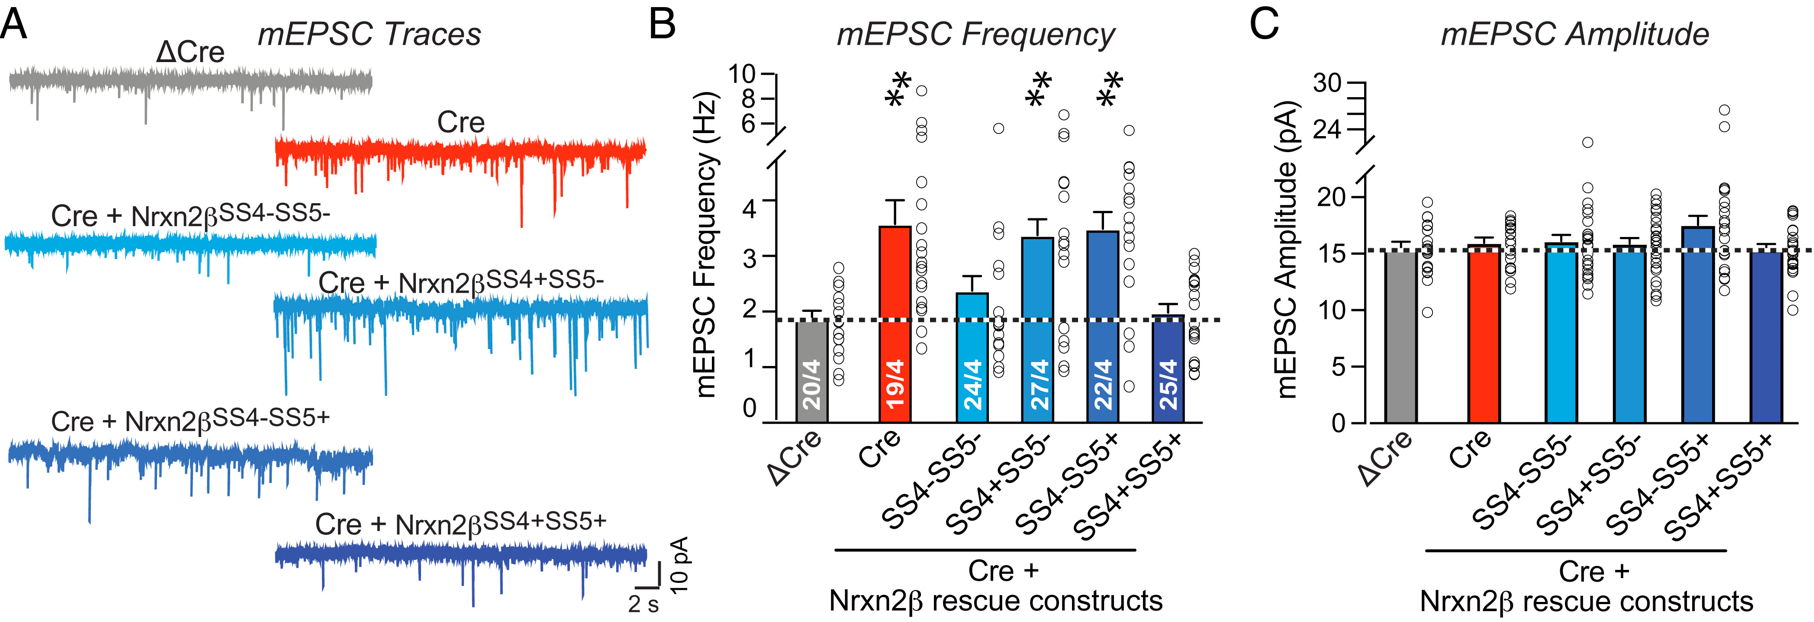
First, a few lines of introduction. The authors of both papers study firing patterns of neural cells. They measure the current spikes emitted by a neuron versus time as shown in the traces in panel (a) below. Each trace is quantified by determining the firing frequency (b) and spike amplitude (c). The frequencies and amplitudes thus come in pairs and each ‘open circle’ data point in the frequency plot of panel (b) has a counterpart in the amplitude plot in panel (c).
Retinoic acid paper / Lu Chen
Shruti Thapliyal, Kristin L Arendt, Anthony G Lau, Lu Chen Retinoic acid-gated BDNF synthesis in neuronal dendrites drives presynaptic homeostatic plasticity eLife (2022) doi: 10.7554/elife.79863
In the Correction from 2 August 2023, the authors appear to have completely re-evaluated their data. All suspect repeats identified on PubPeer are replaced, as are some additional repeats that were not flagged. The supplementary data files and the figures in the paper have been updated. The correction comes with a painstakingly complete description of the convoluted data processing workflow and an explanation of how this led to the duplications. This appears to be a well-done correction.

Having said that, I still have very strong reservations about the ‘original data’ that the authors provided on PubPeer. That data was used to disprove the now-accepted bookkeeping errors:

The above author-supplied table shows that the eight apparent duplications between the yellow columns are not duplications at all. For one, the corresponding firing frequencies are different (‘Freq. of Cell’). This shows that the Fig. 3e and 3f numbers cannot come from the same measurement as they do not form amplitude-frequency pairs. Secondly, the authors found that actually also the amplitudes are different. This magic happened when they looked at the ‘extended decimals’ that were only available in their original data.
The above duplications are now accepted as a copy-paste errors and corrected. One could charitably believe that the mismatch in the ‘Freq. of Cell’ values in the author-provided original data is due to further disorganization that remained unrecognized even after the authors were warned. But neither bookkeeping nor copy-paste errors generate extra decimals. And incidentally every first unpublished decimal makes the numbers different, be it for numbers that were published with 3, 4, or 5 decimals behind the point. For example, 11.163 was actually 11.1627 or 11.1631. And 10.42005 was either 10.420051 or 10.420049.
Lacking any other viable explanation I judge it most likely that the author-provided original data was a fabrication to alleviate concerns of critical peers.
Neurexin-2 paper / Südhof
Pei-Yi Lin, Lulu Y. Chen, Peng Zhou, Sung-Jin Lee , Justin H. Trotter, Thomas C. Südhof Neurexin-2 restricts synapse numbers and restrains the presynaptic release probability by an alternative splicing-dependent mechanism Proceedings of the National Academy of Sciences (2023) doi: 10.1073/pnas.2300363120 (“Contributed” by Thomas C. Südhof as NAS member)
The authors of the Neurexin-2 paper received the first concerns on 25 March 2023, only one day after the work was published by PNAS. The first author responded to the PubPeer concerns in less than two hours, serving her critical peers fabricated replacement data. Two examples are given below:
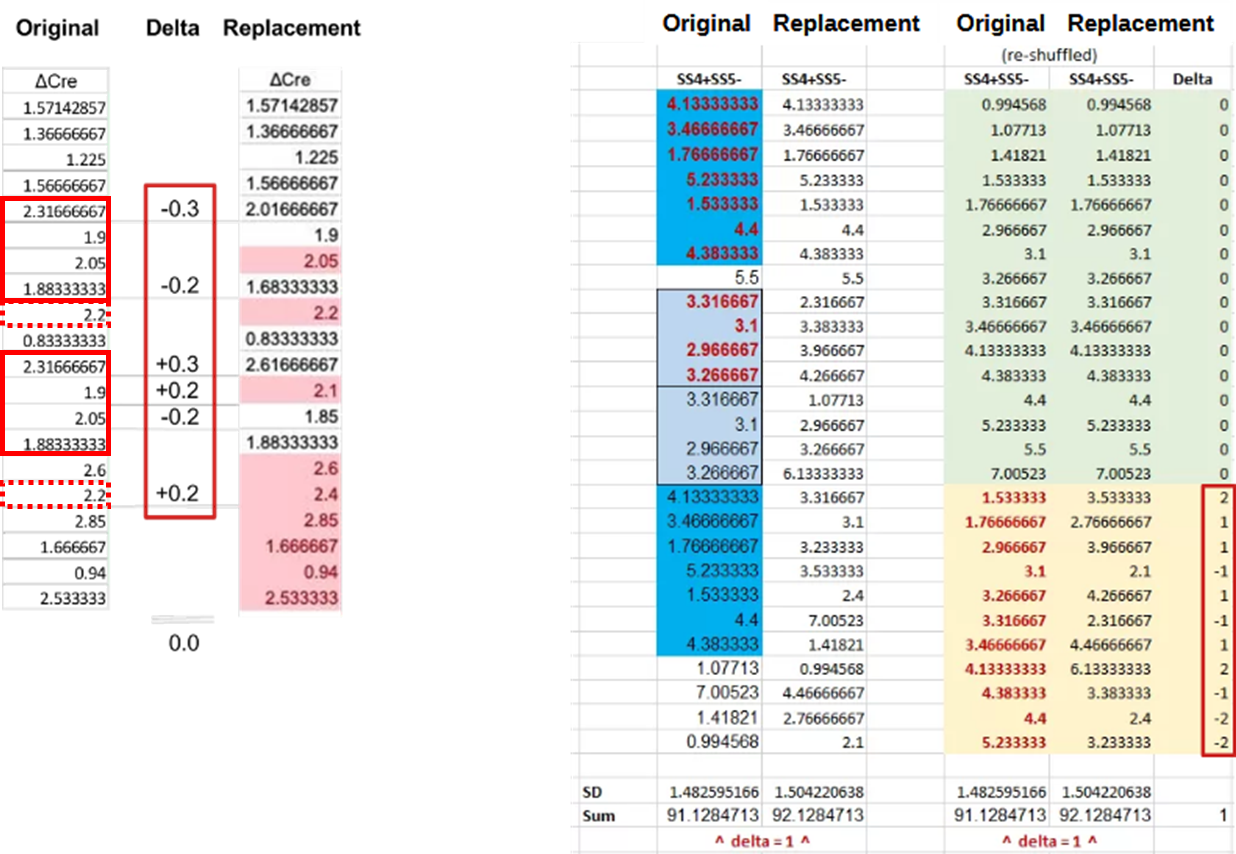
For the ΔCre column (left panel) the first author ‘removed’ repeating sequences of frequency values by simple row-wise addition or subtraction of 0.2 and 0.3. The sum of these changes was zero, nicely preserving the mean. In another fix the author combined ±1 and ±2 ‘corrections’ (see red rectangle, bottom-right) with a complete re-ordering of the data (SS4+SS5-, right panel).
The issue with the repeat sequences was pointed out in March 2023, the fabrication of replacement data in June this year. Then, on 8 August 2023, the senior author announced an upcoming correction (highlights mine):
“These mistakes were due to copy-paste errors that occurred when the data files were compiled from individual data files during assembly of the summary file after the data had been analyzed, the figures had been made, and the paper had been written. Since the figures and conclusions of the paper were generated before compilation of the summary file, the copy-paste mistakes in the summary file did not enter into the paper and the mistakes we made in the summary file have no effect on the actual paper. […]
We have now submitted an erratum to PNAS to correct the record. […] We hope that the availability of original data will clarify the issues raised by the criticisms voiced above and again apologize for the errors in the summary data file. Sincerely, Tom Sudhof”
The above is an exceptionally fortunate outcome: the errors that were identified on PubPeer are the result of copy-paste errors that are solely present in the summary Excel file. And hence the conclusions and figures of the paper can remain as-is: only a new supplementary data file needs to be uploaded and the whole affair can be left behind. The fabricated replacement data is not addressed, but this is maybe of no consequence as it was only published on PubPeer.
The correction is not yet published, which makes it somewhat difficult to criticize it. What Südhof tells us in his announcement is that the data and figures in the paper are correct. But it is not that simple, and I will explain why his planned correction cannot stand.
The following issues are apparent, either related to bookkeeping errors or simply fabrication:
- Impossible repeats in the mEPSC frequency data of Fig. 6(b)
- Fig. 2 and Fig. 6 mEPSC data are inconsistent
- Fig. 4 and Fig. 6 NDMAR-EPSC data are inconsistent
Impossible repeats in Fig. 6(b)
This concern should sound familiar. It was raised in March 2023 and ‘fixed’ by the fabrications that were just discussed above. But, in a cynical turn of events, these fabrications are now deemed unnecessary. The as-published Fig. 6(b) frequency data corresponds perfectly to its supplementary data table that showed these many suspicious repeats:

Initially I assumed this meant that Fig. 6(b) is affected by copy-paste errors. The senior author Südhof however assures us that in this case both the figure and supplementary data are correct:
“In particular, the data criticized here are from mEPSC measurements that have discontinuous values. Thus, for each conditions these data represent repeats of a limited number of values – these are NOT copy-paste errors or duplications but this is inherent in the experimental setup“
But the above is simply so extremely unlikely that it can be safely deemed impossible. The figure below shows the table behind Fig. 6(b), with repeat sequences of 5, 6, and 7 consecutive values highlighted in respectively blue, yellow, and red:

The firing frequencies are derived by dividing the number of observed spikes by the duration of the measurement. This makes the chance of measuring the exact same frequency much higher than one would expect based on the number of decimals in the above frequency values. And this is exactly the point the senior author makes in his PubPeer comment.
Still, in this PubPeer post I come to at most a 1% probability of measuring the same frequency twice in succession. With that value one can estimate the probability of finding a single repeated sequence of a given length, accounting for us searching throughout the whole table:

The longest, 7-value repeat thus has a one in seven billion probability of occurring. Meaning, what we observed in this paper can utterly unlikely have happened by chance. The six value repeat is some 100x more likely to happen, but at one in seventy million it is still a statistically very significant ‘find’.
One can only conclude that there is something seriously wrong with the data in this table, and hence with paper. And below we will get some clues as to what really happened…
mEPC data with bookkeeping errors
The paper shows two figures with mEPC data. One of these is Fig. 6(b) and (c) discussed above. And in the insets of Fig. 2(f) one can additionally find mEPC frequency and amplitude data for the ΔCre and Cre groups:
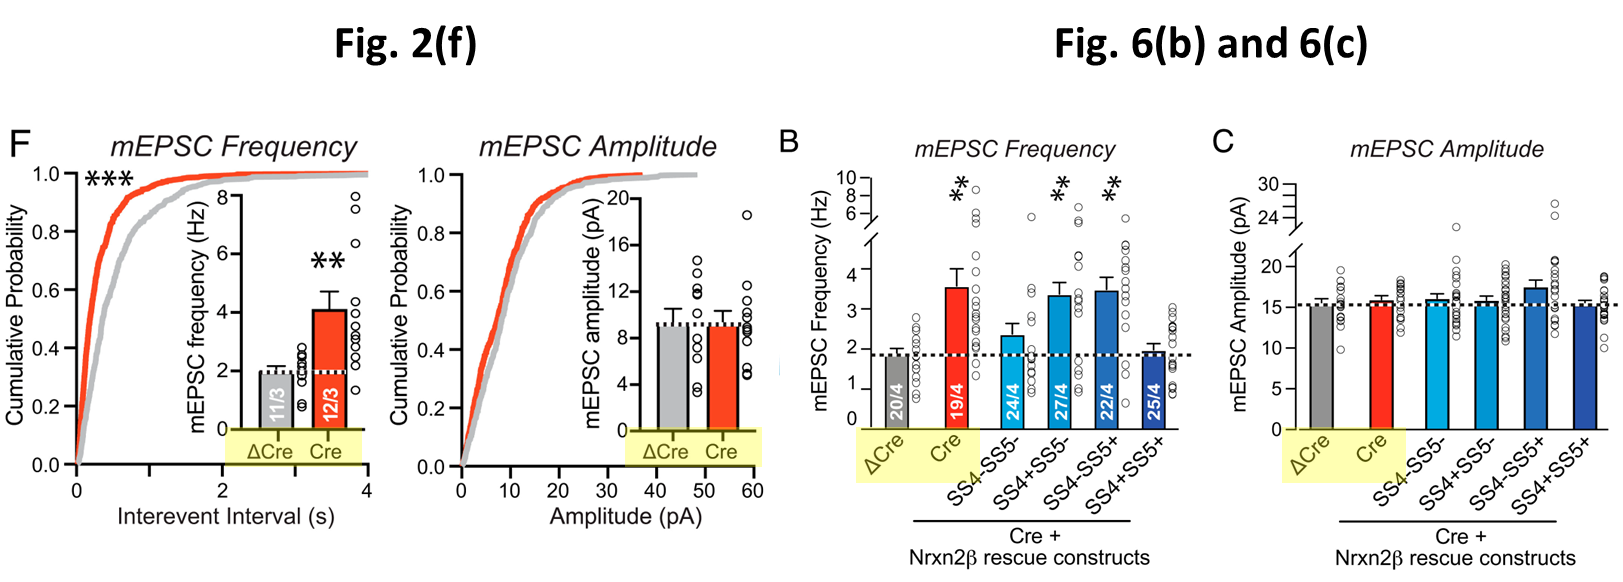
The number “11/3” in the Fig. 2(f) ΔCre column means that the authors took 11 measurements on 3 separate tissue slices. In Fig. 6(b) we find 20/4, so one more tissue slice was used to obtain nearly the double amount of measurements. It is principally possible that the 11 measurements of Fig. 2(f) are part of the data used in Fig. (6). So let’s check whether we can find shared amplitude and frequency values between these datasets…
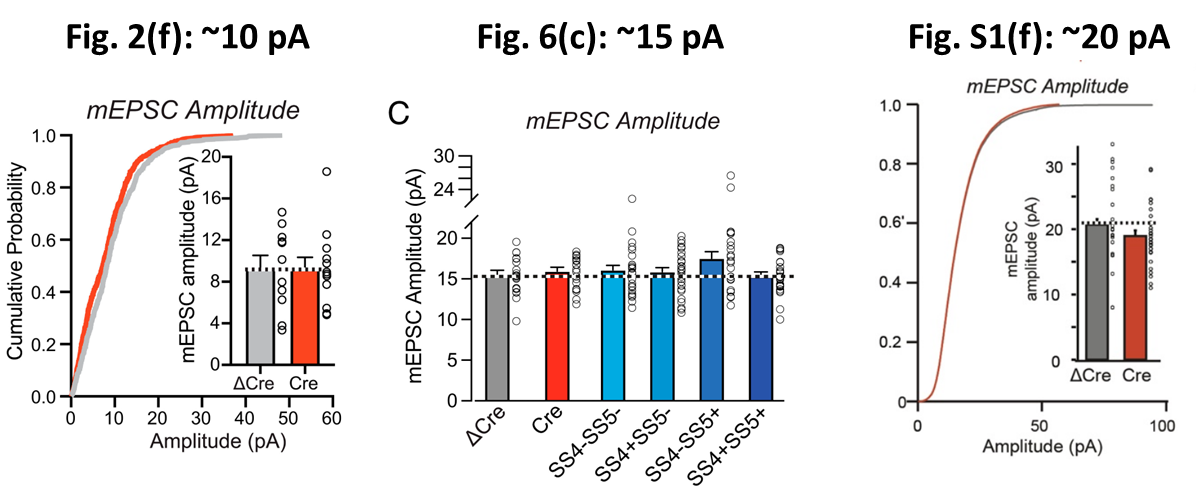
In the figure below I graphically compare the mEPC amplitude data between Fig. 2(f) and Fig. 6(c). Comparing the vertically scaled version of Fig. 2(f) in the middle to Fig. 6(c) on the right one can see little correspondence. For example, about half of the amplitudes in Fig. 2(f) lie below 10 pA while (nearly) all amplitudes in Fig. 6(c) lie close to 15 pA, i.e. at least 50% higher. Also a more detailed comparison below shows no overlap, not even when scaling the data 1.

The amplitude data for both figures is thus derived from completely independent measurements. And given the ‘pairing’ of amplitude and frequency values the same should thus be true for the frequencies. So let’s compare the frequency data:
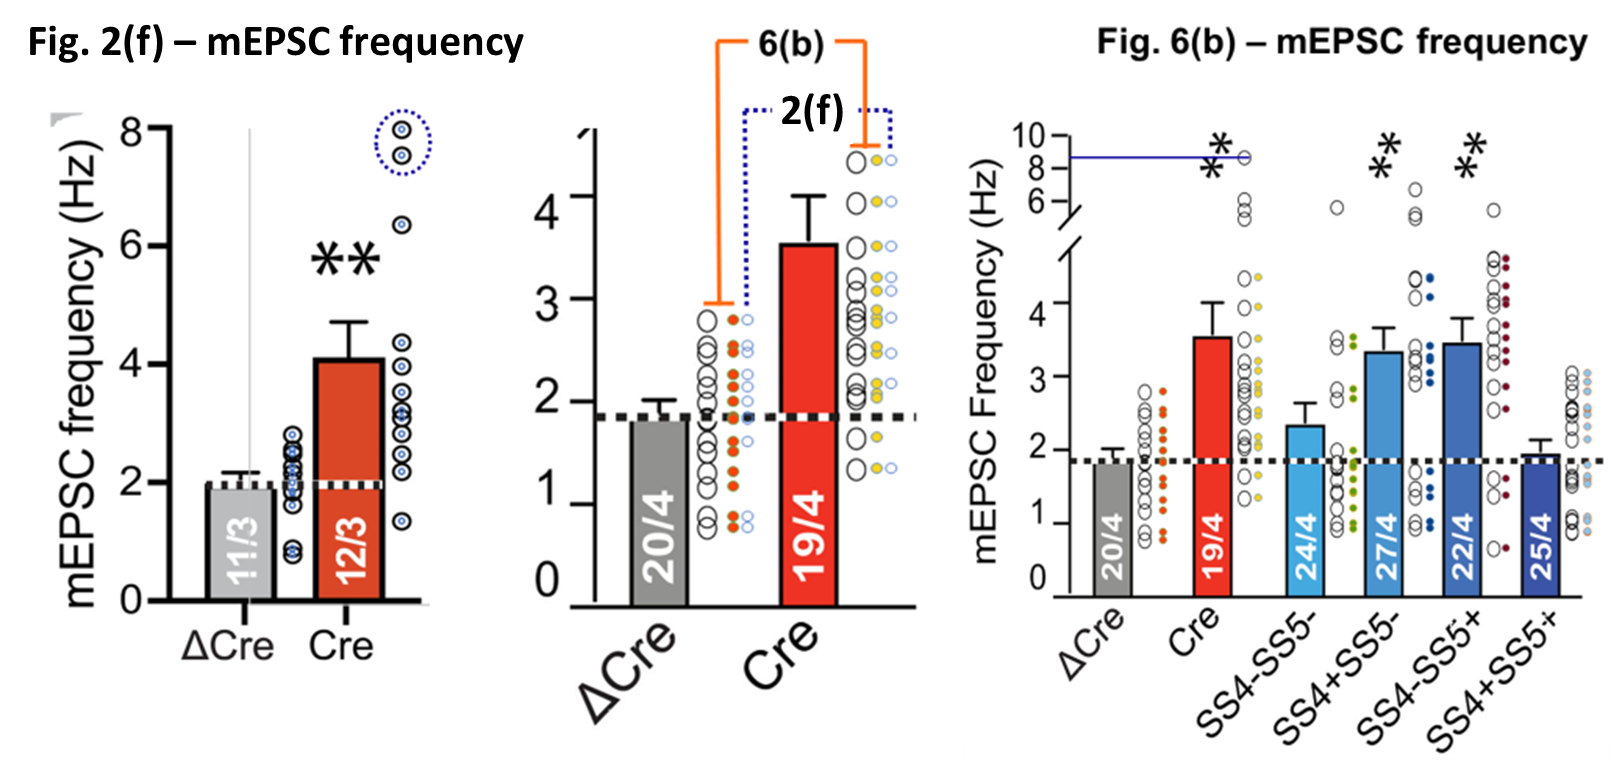
The frequencies reported in the supplementary data for Fig. 2(f) match perfectly with the data in the figure, compare the blue dots with the open circles in the left panel above. And we already found that the same is true for the data in Fig. 6(b), reproduced in the right panel. As a result, we can just look at the numerical data:

And that data shows something very surprising. All eleven ΔCre frequency values of Fig. 2(f) appear in the exact same order at the bottom of the ΔCre column of Fig. 6(b). The Cre column shows a more complicated pattern, with all but two values duplicated at the top of their column in Fig. 6(b).
The observations above already show that, despite the author’s assurances, the as-published paper was struck by at least a few more copy-paste ‘errors’: if the data in Fig. 2(f) would have been a subset of that in Fig. 6, then the frequency-amplitude pairs would have been duplicated. Instead, we only find duplicated frequencies. And there is simply no valid reason for using the frequency values of 21 earlier measurements, but leaving out their ill-fitting amplitude values. And these amplitude values are purportedly substituted by those from new measurements whose frequency values are for unknown reasons left out…
The situation is actually quite a bit worse, with even some hints of a motive. As was already noted, with the addition of only one extra tissue slice the amount of measurements in the ΔCre nearly doubled between Fig. 2(f) and 6(c). Looking in more detail at that column one finds a sequence of four values duplicated (blue numbers in the table below). Together with the single duplication of a 2.2 Hz value in red this only leaves the first four values unrelated to those in Fig. 2(f). One could surmise that of the nine extra ΔCre frequency values in Fig. 6(b) only four were actually measured, with the other five being simply duplications of Fig. 2(f) data.
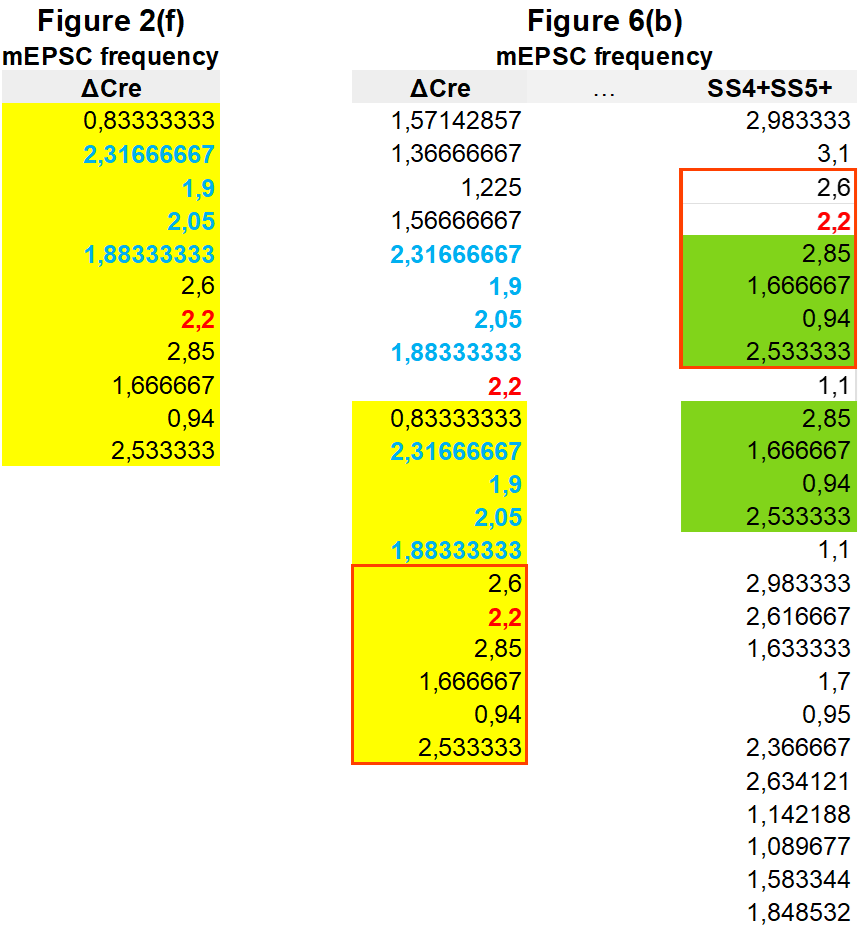
And there is still more. The main premise of this paper is that by knocking out the Neurexin gene the mEPSC firing frequency changes. This knock-out can be ‘healed’ by adding back both the SS4 and SS5 gene. Our ΔCre column above represents the control group and the SS4+SS5+ column at the right the ‘healed’ mice. The more the SS4+SS5+ frequencies look like the control, the more convincing the story. And when looking in detail, these frequencies indeed look very much the same.
The repeated sequence highlighted by the red box is the ‘one in 70 million’ 6-value repeat that was already highlighted in the ‘Impossible repeats’ section. But there is also a 4-value sequence within that repeat that is itself repeated in the SS4+SS5+ column (green highlight). As a result, 10 of the 25 frequency values in the SS4+SS5+ column are shared with both the Fig. 6(b) and the Fig. 2(f) controls. This is extremely implausible, but yes, it certainly helps making the SS4+SS5+ intervention look successful.
NDMAR-EPSC data with bookkeeping errors
More of the same to follow; when you are bored, skip to the conclusions if you like!
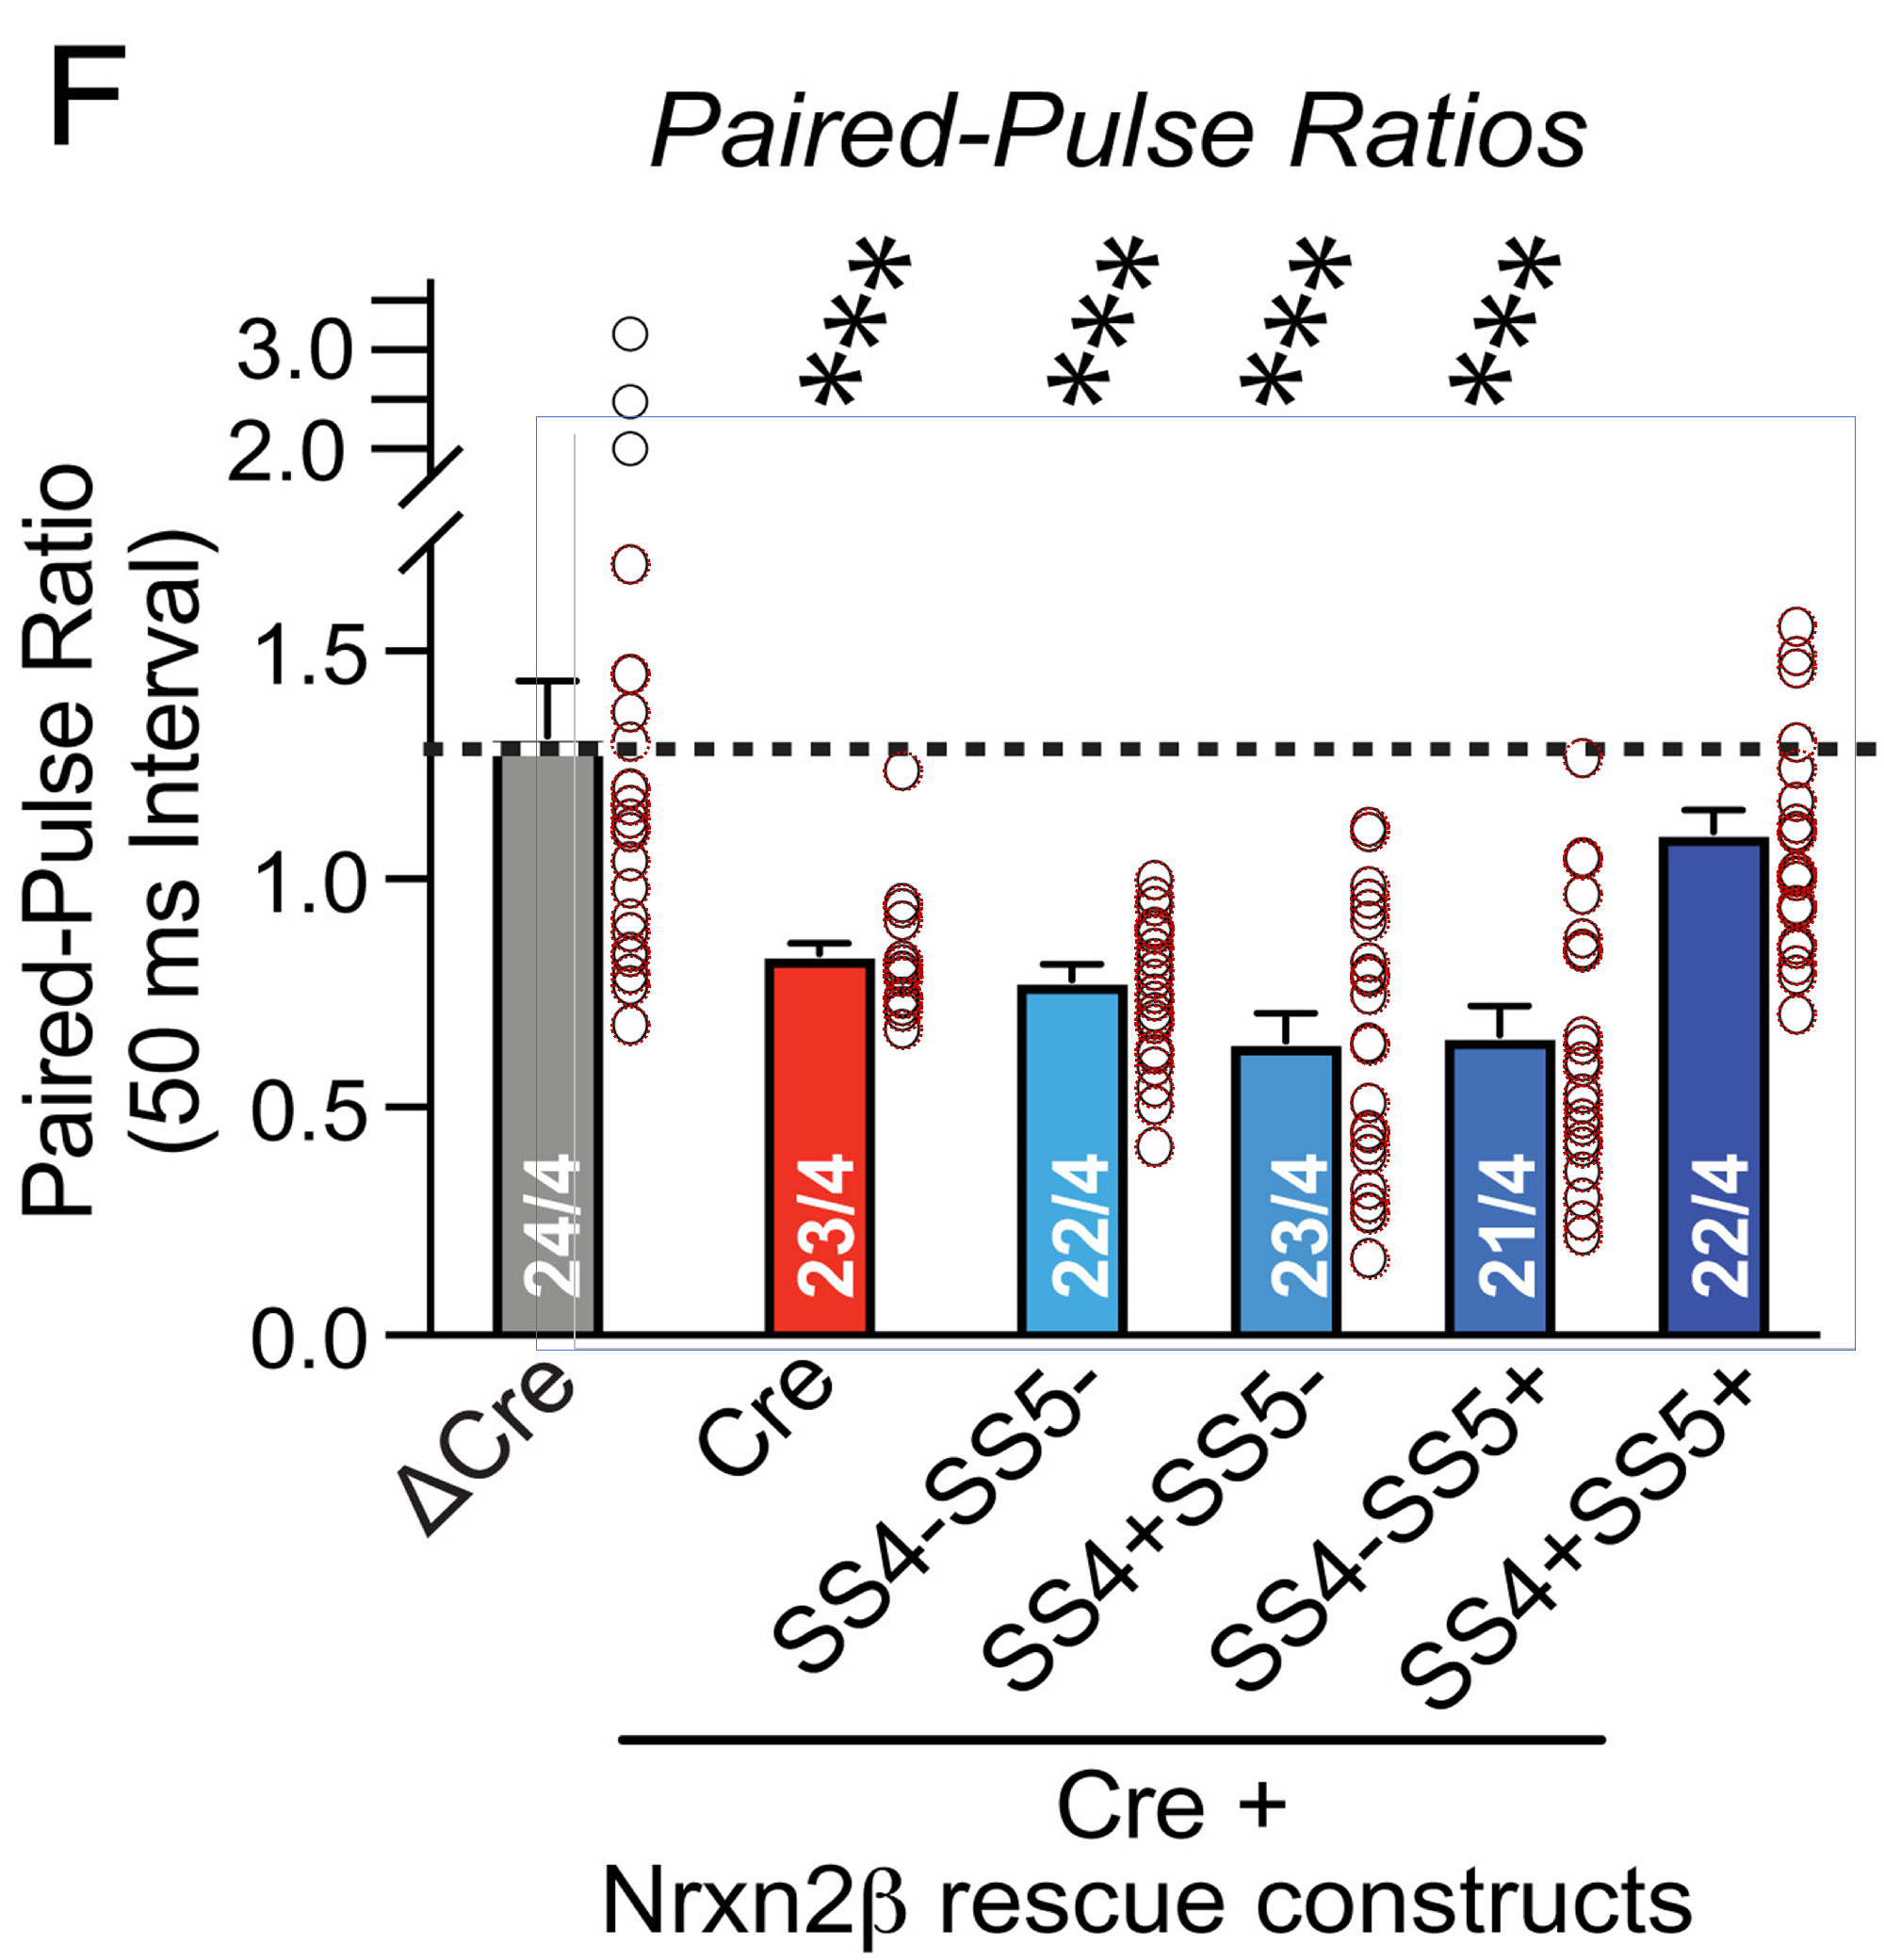
Here we will look at ΔCre NDMAR-EPSC amplitude and paired-pulse ratio data plotted in Fig. 4(e/f) and Fig. 6(e/f):

Also here one could expect the Fig. 4 data to be a sub-set of the Fig. 6 data. And after checking whether the supplementary data tables correspond to the plotted values (they do 2) one can have a look at these tables. Let’s keep to the ΔCre values:
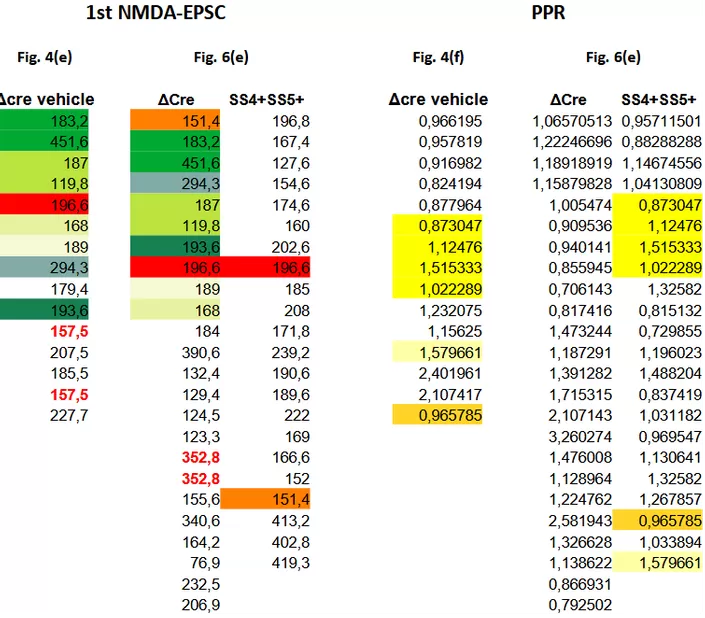
For the NDMAR-EPSC amplitude data we find that the author has re-used nine measurements between the ΔCre columns of Fig. 4 and Fig. 6 (green shades & red). The values are re-ordered but still occupy a continuous row 2 to 10 stretch in Fig. 6(e). The SS4+SS5+ group is mostly spared from coincidences.
When looking at the paired-pulse ratios (PPR) we see something strikingly different. There are zero matching numbers between the ΔCre columns of Fig. 4 and Fig. 6. Instead, we find a sequence of 4 values repeated between Fig. 4 ΔCre and Fig. 6 SS4+SS5+ (yellow highlight). On top of that, two other values can be found duplicated. Noteworthy: all six values ‘migrated’ from the ΔCre healthy control group of Fig. 4 to the ‘successfully treated’ SS4+SS5+ group of Fig. 6.
The above cannot have happened by chance. The Fig. 4 data is clearly not a subset of the Fig. 6 data as the amplitude and paired-pulse ratio pairing is completely broken. At the same time the datasets are not independent: a large number of amplitude values is shared between the ΔCre columns, while paired-pulse ratios are shared between the ΔCre and SS4+SS5+ columns. And having 6 of the 22 values in the SS4+SS5+ column duplicated from control measurements will again help inflate the effect of the claimed intervention. I have a hard time to accept this as honest mistakes.
Of note: this mix-up between control and SS4+SS5+ group was already pointed out in April by Scutellinia korfiana. That user even send a kind reminder to the authors after the concern seemed to have been ignored.

Conclusions
The authors of both the Retinoic acid and the Neurexin paper seem to have tried to alleviate the concerns raised on PubPeer by providing fabricated data. This is abundantly clear for the Neurexin authors; for the other paper it may simply be my lack of imagination when it comes to bad bookkeeping.
The authors of both papers have submitted corrections to the respective journals. The Retinoic acid correction in eLife appears exemplary in its detail and corrects more issues than were pointed out on PubPeer. The Neurexin correction should never be accepted by PNAS.
I raised the above concerns both on PubPeer and with the publisher and believe them to be convincing. And now even the senior author of the paper is starting to realize that something is amiss. In August Südhof’s response to the concerns raised on PubPeer was a repeated:
“Please analyze the raw data. We cannot base our conclusions on statistical probabilities, we have to rely on actual data.”
More recently, on 27 September 2023 and a bit over a month after the last concern was raised, the senior author posted the following (highlights mine):
“We agree that in addition to the multiple copy-paste errors in the original source data file, the uneven selection of shared vs. non-shared data for the controls in some Figures did not meet the standards of scientific rigor that we aim for, although this is not in itself against the rules if shared data used in different experiments as long as the experiments were performed at the same time in the same batch with the same controls. Naturally if only a subset of shared control data are selected for analyses, they have to be randomly and evenly selected. We concur, furthermore, that the ‘replacement source data’ provided by Dr. Pei-Yi Lin, the lead author of the paper, are likely erroneous.”
If one was cynical, once could consider this to be maneuvering towards an impending retraction, with as an opaque as possible retraction notice 3. Retracting a paper because the underlying data is fraudulent hurts, especially when you realized the fraud only after some six months of external pressure whilst insisting on the “wait and look at the raw data” approach. It is obviously much nicer to write that one retracts a paper because “the uneven selection of controls in some figures did not meet the high standards of scientific rigor that we aim for“. Meaning, a good paper is retracted for not being excellent.
In the last bit the senior author acknowledges there was something wrong with the replacement source data provided on PubPeer. I hope this makes the authors also more seriously question the data presented in the paper itself.
In all, I think this is an as-happy end as it gets when raising concerns.
1 . I am not a neuro-biologist, so maybe I am saying something stupid here. The paper actually shows three sets of mEPSC amplitude data: Fig. 2(f) and 6(c) discussed above and Fig. S1(f). The latter is a replication by a second researcher, presumably to prevent confirmation bias or maybe even fraud. In the figure below I compare the reported mEPSC amplitudes. Each figure shows a largely different average amplitude of respectively ~10, ~15, and ~20 pA. These differences are very significant: the standard error of the mean is 1-2 pA. How come these experiments are internally so consistent, yet differ so much between each other? It obviously also makes it rather impossible to aggregate the amplitude data.
2. Long comparison of the supplementary data with the plots in the published paper for the ΔCre and Cre groups in Figs. 4(e/f) and 6(e/f). The values in the supplementary data for these groups correspond to those in the published figures as shown by the perfect match between the black circles from the published figures and the overlaid red circles representing the values from the supplementary data.


3. I am for example thinking of Nature’s retraction of Ranga Dias first “Room-temperature superconductivity” paper. Instead of calling out the paper for fabrication, the retraction notice states: “the background subtractions applied … used a non-standard, user-defined procedure”. This likely helped the same authors to publish their second room-temperature superconductivity Nature paper earlier this year. And, ironically, it seems the same “background subtraction” reason can be repeated for its upcoming retraction.

Superconductive Fraud: The Sequel
“After the huge box-office success of “Nature 2020: Room-temperature superconductivity in CSH” this March our Nature studios released a sequel with the same star-studded cast: “Nature 2023: Near-ambient superconductivity in N-doped LuHx”. – Maarten van Kampen
PS by LS
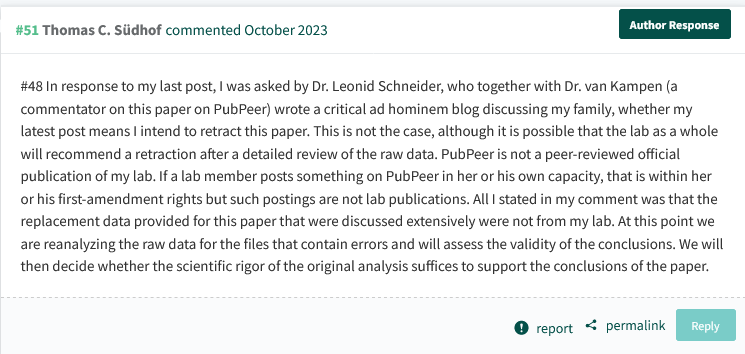
I wrote to Südhof (with Chen in cc), asking if he indeed announced to retract the Neurexin paper. Nobody replied to me, but right after my email, Südhof posted this on PubPeer:
“In response to my last post, I was asked by Dr. Leonid Schneider, who together with Dr. van Kampen (a commentator on this paper on PubPeer) wrote a critical ad hominem blog discussing my family, whether my latest post means I intend to retract this paper. This is not the case, although it is possible that the lab as a whole will recommend a retraction after a detailed review of the raw data. PubPeer is not a peer-reviewed official publication of my lab. If a lab member posts something on PubPeer in her or his own capacity, that is within her or his first-amendment rights but such postings are not lab publications. All I stated in my comment was that the replacement data provided for this paper that were discussed extensively were not from my lab. At this point we are reanalyzing the raw data for the files that contain errors and will assess the validity of the conclusions. We will then decide whether the scientific rigor of the original analysis suffices to support the conclusions of the paper.”
I have several issues with this reply, here are some of them:
Maybe as an immigrant to US, Dr Südhof is not yet fully aware of what the First Amendment really means. It grants a right to unrestricted free speech, but does not free you from responsibility for what you say or write, especially in public, especially in professional capacity. If one posts fraud like his lab members do, one can be called out even if this platform was “not a peer-reviewed official publication“. Be it on PubPeer, in a preprint, or in an NIH research grant application.
Finally, I believe it is not up to Südhof and his lab of irresponsible equals alone to decide whether or not their paper should be retracted or not. But for the scientific community, which is why Maarten and myself published this second “ad hominem” post.

Dr. Ignarro has suffered stigma, and was denied at least two interviews on television
“The presence of such articles online have severely affected Dr. Louis J. Ignarro’s public reputation, and his personal life. Dr. Ignarro disputes any accusations of wrongdoing. There was no fabrication of data, although there was a mistaken duplication of data which occurred due to error. None of the data was false.” -J.L. Perez, Esq.
I thank all my donors for supporting my journalism. You can be one of them!
Make a one-time donation:
I thank all my donors for supporting my journalism. You can be one of them!
Make a monthly donation:
Choose an amount
Or enter a custom amount
Your contribution is appreciated.
Your contribution is appreciated.
DonateDonate monthly

Südhof’s comment quoted in PS has been moderated by PubPeer (together with Maarten’s reply). Reasons:
“This may be a good opportunity to stress that PubPeer operates its own independently developed policies and can bear no responsibility for and cannot be assumed to condone statements and extrapolations elsewhere that have been woven around PubPeer threads. […] In short, this is not the place for the exegesis of external commentary; future irrelevant discussion will also be rejected.”
Südhof’s reaction on PubPeer is to play a victim of cancel culture:
“That seems unfair given that ‘implicit’ allegations of misconduct are being expressed without us being able to respond. Journals and universities outsource their due diligence to this site and authors must have the opportunity to respond to implicit allegations of misconduct.”.
I agree, instead of complaining on PubPeer about articles on For Better Science, he can reply to my emails, or comment under this article.
LikeLike
Both fairly so, them being no longer an exchange on the content of the paper itself.
LikeLike
If Dr Südhof doesn’t want to reply here, I am sure NYT or WaPo or even Fox News will oblige a Nobelist if he wants to use their platform to complain about ad hominem hounding of his family.
LikeLike
Südhof keeps raging against me and Maarten, and gets moderated.
This part of his comment is online:
“All the questioned raw data for this paper are available at
https://purl.stanford.edu/cp231wr9194
Our lab does not consider PubPeer an official lab publication since it is not peer-reviewed.
Another lab member will perform a reanalysis of the raw data and assess if the conclusions of the paper are justified. “
The only type of investigation of his data which Südhof allows is one by a person he employs and has full and total control over their entire career. I will let my readers wonder why he seems so scared of having someone truly independent and unafraid to investigate his data.
LikeLike
Since Südhof insists to communicate only via peer reviewed platforms, and this is the kind of peer review he allows:

Katsuhiko Tabuchi was Südhof’s postdoc for 10 years.
Z. Josh Huang has common papers with Südhof, but otherwise he doesn’t share his CV or career history anywhere.
LikeLike
For Better
Fabrication?
LikeLike
Absolutely, you should fabricate your data way more better than simply copy-pasting. However, this requires a little intelligence at a moderate level, which you have not shown to possess yet.
LikeLike
“a critical ad hominem blog discussing my family”
What kind of “family” does he mean? Eccentric life forms of the Kroemer-Universe?
LikeLike
I want to point out an additional strange issue with the “extended decimals” explanation regarding paper 10.7554/elife.79863. In the data for Fig. 3e, the first three values listed are shown as 10.42005, 10.84676, and 11.163.
Now, unless the authors have done something very odd with the formatting of their spreadsheet, the fact that the third number shows three decimals while the previous two show five, means that the two additional decimals in the third number are zeros.
I.e., the third value, if extended to five decimals, should be 11.16300. Similarly, 12.1283 (with four decimals) means that the fifth is a zero: 12.12830. This is the way formatting of decimals works in Excel or, as far as I know, any other spreadsheet program.
LikeLike
Chen’s lab should have uploaded the raw Clampfit data rather than explaining BS. An impossible is an IMPOSSIBLE!!!! No matter how you rephrase it.
LikeLike
Per PNAS website, one of the reviewers of Lin et al is Katsuhiko Tabuchi who is former lab member of Sudhof Lab 😦
Was the so called peer review process of Lin et al a compromised !!!
https://www.pnas.org/doi/10.1073/pnas.2300363120
http://www.shinshu-u.ac.jp/faculty/medicine/chair/i-2seiri/tabuchi.html
LikeLike
It was supposed to be compromised. “Contributed” track at PNAS means that a NAS member (here, Südhof) organises the peer review for his own paper. Two positive reviews from friends are submitted with the manuscript. Much crap got published this way.
LikeLike
The question on the extra decimals has been unanswered for some 1.5 month. So it is likely a complicated one.
Unfortunately the authors actually do use rather arbitrary formatting, rounding their values to varying number of digits. I pointed this out in my previous post as the duplicated numbers often also stood out in their number of decimals behind the point.
I do however think it is very unlikely that the authors decided to round to three decimals behind the point. And this is what one needs to assume when the published 11.163 actually was 11.1627… or 11.1631…
The authors either never rounded to the rather odd and low number of 3 decimals behind the point, making the observed occurrences just 5 decimal values ending in 00. And by that making the author’s explanation impossible, as you pointed out. Or the authors very rarely did it (~0.5% of the values) and then were lucky enough to also ‘hit’ this very special case. “Improbable? yes. Impossible: no!”.
LikeLike
In the world of science, where minds collide,
There lived a man named Südhof, with research as his pride,
He claimed to be hounded, ad hominem attacked,
But the truth of his papers, oh, how they lacked!
With words so grand and studies so bright,
He thought he could dance in the scientific light,
But little did he know, his fraud was revealed,
In the hallowed halls of science, his fate was sealed.
“Oh, I’m hounded!” he cried, with a dramatic flair,
While his papers crumbled, beyond repair,
He pointed his finger, but the evidence was clear,
His scientific facade, it had disappeared!
The world shook its head at Südhof’s tale,
A comical saga, destined to fail,
For in the realm of truth, there’s no room for deceit,
And in the end, it’s honesty that scientists greet.
So let this be a lesson, a cautionary rhyme,
For those who tread the path of scientific crime,
No matter how you spin it, or how you try,
The truth will prevail, and fraud will die.
Thank you, MvK & LS.
LikeLiked by 2 people
Brilliant. What music shall this ballad be sung to?
LikeLiked by 1 person
Death or doom metal.
LikeLike
Hmmm… Performed by The Mountain Goats? https://www.youtube.com/watch?v=VZ6O7Jk4MXs
Jarvis Cocker? https://www.youtube.com/watch?v=yuTMWgOduFM
Albert’s Doom or Death Metal suggestion below might be fun too.
LikeLike
Yes! Common people! Because obviously a Nobelist is above the mere mortals. Who wants to record the song?
LikeLike
Thomas C. Südhof is now a “Cry Wolf” blaming pubpeer for exposing his false empire so called “Südhof lab” . It is a shame for him to talk about Censorship while his fabricated stories should be published by his friends through a so called compromised “peer review” processes in fancy journals so he could keep receiving $MM for his pleasure of fabricating stories and misleading others in research .
LikeLike
Thank you for your amazing work. The scientific community needs people more like you.
It’s so upsetting to know that this research is funded by tax payers money. What a waste…this type of fraud can be prevented if initial submissions require all the raw data not just fancy plots and images.
Sudhof once said on Alzheimer’s research fraud “The immediate, obvious damage is wasted NIH funding and wasted thinking in the field because people are using these results as a starting point for their own experiments”.
I think he should read his own words out loud to feel the level of damage his lab is causing to the society.
LikeLike
Do you have the link where Südhof said this about fake science?
LikeLike
just google “The immediate, obvious damage is wasted NIH funding and wasted thinking in the field because people are using these results as a starting point for their own experiments”:
https://www.science.org/content/article/potential-fabrication-research-images-threatens-key-theory-alzheimers-disease#:~:text=%E2%80%9CThe%20immediate%2C%20obvious%20damage%20is,on%20Alzheimer's%20and%20related%20conditions.
https://www.nature.com/articles/d41586-022-02081-4
LikeLiked by 1 person
I took a first look at the raw data. With all of the mEPSC frequencies of Fig. 2f coming back in Fig. 6b (in the exact same order) it would be expected that the two figures share a lot of raw data. This seemed to be confirmed by Sudhof, who commented on PubPeer:
“we tried in some cases to combine as many experiments into a simultaneously performed set of procedures. This is an ethically justified approach if only to save resources and animals.”
And then, just maybe, the very different mEPSC amplitude values could be the result of analyzing the exact same traces using very different settings. This then kept the frequencies values exactly intact and only changed the amplitude determination.
However, the raw data comes in files that are named using a data-serial number combination. And the figures do no share any raw data files. The closest measurements were taken 4 days apart. Still the published data tables feature the exact same frequency values in the exact same order.
The above will not convince Sudhof, as this could just be statistics. But everything is in the end statistics, be it two identical WBs, a paragraph of identical text between two papers, or a long list of values perfectly copied/’reproduced’ between experiments. If one in many billions does not work, common sense should.
I also looked at the raw data and I see many, many choices one has to make before getting to the values that were published. Like: When is a spike a spike and not noise? What threshold to use? What method to use to get an amplitude value? How to get to frequency values? Divide the spike count by the 179.95 (or so) seconds of the measurement’s trace length? Or subtract the 2s without useable signal at the start of the one trace I looked at?
I feel that without knowing the exact analysis recipe I (or others) can never reproduce the exact same numbers as were reported. For doing science that is not too bad; the frequencies and amplitudes will be ok and can be compared relative to each other. But for checking whether it is anywhere believable that one can extract the exact same frequencies from different measurements these choices are detrimental. I simply won’t be able to. And I am sure this is because they are not identical. But one could argue that my analysis is just different.
Hope that there is a neuroscientist out there that happens to know that there is some automagic analysis that always spits out the correct numbers…
LikeLike
I agree that without the exact parameters they used for mEPSC analysis is hard to reproduce the same results. However if one can use minimal threshold of 5 pA (that’s what’s said in method section of the paper), it means that anything above 5 pA was taken as a “mEPSC event”. If someone decide to reproduce the analysis, they can just simply detect everything above 5pA. HOWEVER, my biggest issue with the recording is how poor the quality of the signals is. In a standard lab, people do not include these “crappy” recordings in their analysis and present such “fancy” graphs using these poor data. Another obvious question is that in some recordings the level of background noise is around 10pA or even higher, how could you even detect mEPSC events between 5pA threshold and 10 pA. You are basically taking noise as mEPSC event!
LikeLike
LikeLike
I do believe too that we can never be able to reproduce the data not beacuse of the method of analysis but simply because the data are fabricated.
It doesn’t matter if you count the first or last 120s or longer, you should be getting the same frequency and amplitude. If not, how could you possibly rely on the output of the experiment?
There are two standard ways of analyzing these recordings:
1- keep the period of recording time constant between cells and count the number of events
2- count the first 50 or 100 or whatever events and divide it by the period of time
The important part is to keep the recoding and analysis method consistent between cells.
This is the first author’s response once was asked on how the analysis was done
“I took the first ~100 events (depending on the analysis software, might between 100-110) and divided them by the period of time between the first and the last events”
LikeLike
Thanks! But that is obviously incompatible with the frequencies in the table; these show that the denominator is often 120 or maybe 60 s. That is very different from counting the first 100-110 peaks and then dividing by the period of time. Also Sudhof stated (https://pubpeer.com/publications/DAF32F6DB6C166337E5381F769AE52#41):
Thanks – all our methods are described in detail in our papers. Briefly, for mEPSCs/mIPSCs we generally monitor 5 min recordings or 300 events, whatever comes first. Please note that the absolute numbers determined depend on the background noise, filters applied, thresholding, and event picking. As always in biology, what counts are relative changes as a function of a biological controlled manipulation.
LikeLike
Wrt frequencies: my version https://pubpeer.com/publications/DAF32F6DB6C166337E5381F769AE52#34 and possibly your version https://pubpeer.com/publications/DAF32F6DB6C166337E5381F769AE52#11
LikeLike
Did you see this PubPeer comment by ” Infectious flacherie” who analyzed the raw data Südhof posted.


“In the paper it is reported that there is a significant difference between dCre and Cre groups in CV, however using the raw data provided in the depository, there is no significant difference between the two groups. Please see below.”
“Note: The values reported in published Figure 3C are higher than what I calculated, it is possible that the authors reported CV % (CV = standard deviation / sample mean x 100), which is not indicated in the method section. However regardless of reporting the calculated CV or CV (%), there is no statistical difference between the two groups and none of the calculated CV values matches with the reported published Figure 3C. Please see below the calculations.”
“I have serious concerns about the quality of the data. Whole cell recording configuration should remain stable throughout the measurements with close to zero leak current. A leak current occurs whenever the seal between a pipette and cell is not perfectly insulated from the bath solution. For some reasons, the majority of the recordings for Figure 3B-D are leaky, from -400 pA to even -2500 pA!. This enormous leak is sometimes accompanied with high level of noise. In addition, many of the recordings are not even voltage clamped properly as can be seen by the instability of the response after stimulation. I am surprised that authors decided to include these recordings in their measurements and use them to draw conclusions. Please see below for an example and leak level for each recording.”
“It is expected that the measurements from different cells in same group or different groups stay consistent. However, I noticed that recordings range from a single stimulus and 4 trials of recordings to double/triple stimulations and up to 30 sweeps. ln order to be consistent throughout my analysis I selected the maximum of 11 “clean” trials for each recording from the first stimulus. please see below for some examples.”
LikeLike
#70: Mr “Cry Wolf” is now “beating around the bush”!!! what a guy or what a couple!!!
LikeLike
” Overall, we concur that there are major inconsistencies with the source data of this paper compared to the existing raw data, which we are puzzled by. Note that the raw data, unlike blots or images, cannot be manipulated and contain identifiable metadata. Our current preliminary conclusion thus is that, consistent with some of the comments, the source data of this paper contain major flaws that cannot be explained by copy-paste mistakes as I had mistakenly surmised earlier but must have another origin.”
The raw data is unreliable but it is not fake. We can’t trust the results but conclusions are not affected. I won’t admit I will have to retract my paper but I am ready to retract it.
LikeLike
I like the fact that they’re using Microsoft Excel (Windows XP Edition) for data processing. Support for this product from Microsoft ENDED IN 2006! Maybe a virus got onto the PC used for this, and that’s how the data got messed up?
LikeLike
This may already have been posted.
17 October 2023 Expression of Concern for Thomas Südhof in PNAS.
https://www.pnas.org/doi/10.1073/pnas.2316399120
LikeLike
This is good news. Finally some actions by PNAS about this massive fraud..
LikeLike
According to my information, Sudhof’s postdoc Pei-Yi Lin is currently on leave.
Meanwhile, Tom posted this:
https://med.stanford.edu/sudhoflab/science-resources/integrity—pubpeer.html
“Since 2022, the Südhof lab has been featured in an increasing number of PubPeer posts alleging problems with published papers. In parallel, authors of PubPeer posts have published blogs and issued tweets that provide ad hominem criticisms of the Südhof lab, Tom Südhof, and Tom Südhof’s family.
PubPeer provides a valuable service to the scientific community in identifying potential problems with published papers and discussing important issues of reproducibility. Regrettably, however, PubPeer is non-transparent and censors comments. Moreover, PubPeer allows anyone to post comments at the discretion of the PubPeer ‘moderators’ without accountability. In addition, PubPeer posts are communicated to journals and university administrators in order to apprise them of potential problems with papers without the possibility of feedback by the accused, resulting in a situation where journals and university administrators effectively outsource their quality control to PubPeer.
Given this situation, this site aims to improve accountability and to make allegations of issues with our work fully transparent. To this end, we here post an accounting of PubPeer posts regarding the Südhof lab and describe our response to these posts, which is done in an effort to circumvent censorship.”
I still suggest this sad helpless victim of cancel culture and censorship contacts NYT, WaPo, WSJ, Time, CNN, Fox News with his story. He will get more airtime than he can handle.
LikeLike
why Tom’s Twitter is closed????? I see the icon in the link you shared, and clicked on it; but it shows Tom is really a victim of cancel culture and censorship. This poor guy really needs air time to share his BS thoughts with the rest of the world.
LikeLike
Südhof deleted his account in 2022. Last exchanges refer to Cassava.
But now we know on whose payroll Maarten really is.
https://x.com/pei_guy77/status/1682190835729793024?s=20
LikeLike
I wonder why PNAS, Neuron and Nature are giving Tom so much time to see if he could provide any explanations for his recent academic misconducts! This thief of science (i.e., so called Nobel prize winner or whiner) is spending his time to update his Wikipedia page and his Stanford websites – amazing that he is now advising the obsolete UN on science (likely to milk Chinese and poor African nations as he is afraid of NIH and other US funding actions)! May God Bless America and Western Countries for supporting actual science and truths.
LikeLike
Tom is being cancelled! Journals don’t allow him to publish his retractions! #cancelculture #whiteracism #mensexism #antigerman
LikeLike
Is it all really that bad? He initially mishandled a misconduct case. A number of papers from his group have a few rows of erroneus data in their supplements. And a western blot was beautified or so.
I see how attacking PubPeer, invoking first amendement rights, and complaining about this scrutiny is not helpful. But what is making him a thief of science?
LikeLike
If you carefully read Tom/Lu responses in PubPeer, they keep noting that the conclusions are correct despite the fact that there are strong evidences of academic misconducts in result and method sections!!! I first wondered why they keep saying that conclusions are correct while the results are based on wrong experiments/ data inputs/methods – should it be prudent to doubt about conclusions at least at this point? The same can be seen in the couple responses for statistical methods and blots. Based on these positions and responses, one could imagine that authors were likely tasked to support their conclusions before the study even began. i.e., it appears that Tom/Lu already knew fabricated/fictitious conclusions/stories before the results were produced and entire manuscripts and fancy plots were just part of their false show!!! Note also that their past research can only investigated if they share raw data/blots (which they obviously avoid as it is clear in their responses where erratum were submitted to journals – i.e., good couple/team cover up). The recent website updates are just to re-brand themselves as scientifically dedicated couple after these NEWS are public (again to cover up)!!!
LikeLike
Not approved by PubPeer, and Südhof also never replied to my email:


Shuzo Sugita , Ok-Ho Shin , Weiping Han , Ye Lao , Thomas C. Südhof
Synaptotagmins form a hierarchy of exocytotic Ca(2+) sensors with distinct Ca(2+) affinities
The EMBO Journal (2002) doi: 10.1093/emboj/21.3.270
A reader contacted me wondering why the first lane in each gel of Figures 2 and 3 is spliced on. This is peculiar since the authors write in figure legends: “Data shown are Coomassie Blue-stained gels from a single representative experiment repeated multiple times. ”
“Data shown are from a single representative experiment repeated multiple times”
So if the authors kept repeating the experiments multiple times, why couldn’t they at some point arrange the samples on a gel correctly, to avoid gel splicing? As many other labs successfully achieve?
LikeLike
LikeLike
5 March 2O24 retraction
https://www.pnas.org/doi/10.1073/pnas.2403021121
LikeLike
This retraction puts the earlier study published by the same group of authors from Sudhof’s lab under series question. The study published in Science Adv. before the PNAS paper which basically discusses the main falsified findings presented in the retracted paper. I wonder whether the authors should release the raw data for the Sci. Adv. paper as well….
https://www.science.org/doi/10.1126/sciadv.add8856
LikeLike
A reference for your next article (https://journals.plos.org/plosbiology/article?id=10.1371/journal.pbio.1002547)
LikeLike
” The increasingly severe problem here stems not from outright fraud, which continues to be rare. Instead, the problem is due to biased interpretations of experimental results. These interpretations lead to exaggerated statements of fact (a.k.a. conclusions), which not infrequently are only distantly related to the actual data in a paper.”
In Tom’s case, fake data was interpreted correctly. Hence, conclusions not affected!
LikeLike
‘Never, however, has the need for action been more urgent than now, when our entire society is increasingly threatened by untruthfulness, with science being only a tiny part of it. Because the driving factors behind the threats to scientific practice are economic and political, we should speak up and express our concerns. ‘
Well done. MvK, LS, et al. TS would be proud.
LikeLike
Interesting how Sudhof rehashes the old complaints by senior investigators of the system of research/publishing (peer review, journal responsibility) while missing the main problem: members of the scientific precariat class who are desperate to escape their circumstances and will cheat to do it, which weeds out honest research. Will he address this? If he does not acknowledge that this is the main problem, it seems unlikely.
LikeLike
We love you Marteen – nice comment! keep up the good work! World needs more people like you and Leonid.
LikeLike