
The German-born neuroscientist Thomas C. Südhof won in 2013 the Nobel Prize in Physiology or Medicine for “discoveries of machinery regulating vesicle traffic, a major transport system in our cells”. Südhof left Germany for USA in early 1980ies and is currently endowed professor at Stanford University, and a Howard Hughes Medical Institute (HHMI) investigator. He is married to the Chinese-born neuroscientist and his fellow professor at Stanford, Lu Chen (both in their second marriage).
And now Elisabeth Bik and other PubPeer sleuths started to go through Südhof’s and Chen’s papers, finding irregularities. Maarten van Kampen joined, found even more!
The sudden attention to the neuroscience papers by Südhof may be connected to the general atmosphere in Stanford right now. The university’s president Marc Tessier-Lavigne, a fellow neuroscientist as it happens, is currently under research misconduct investigation for long-known evidence of data forgery. There, new unflattering things from Stanford president’s past came to light thanks to the amazing investigative reporting by Theo Baker in the student newspaper Stanford Daily.
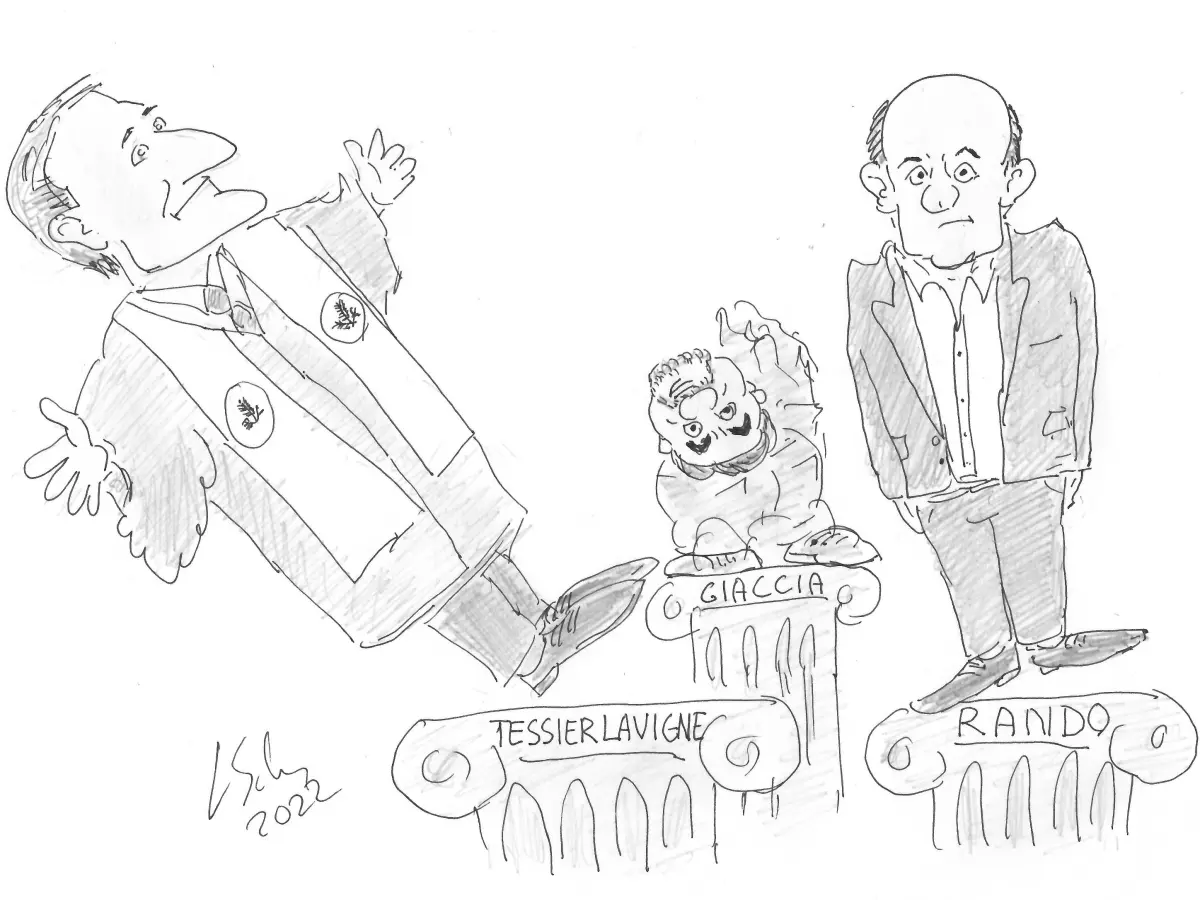
Toppling Giants in Stanford
Everyone is talking about Stanford’s President Marc Tessier-Lavigne now. OK, let’s talk about him, and how Stanford deals with research fraud. And then let’s talk about Thomas Rando.
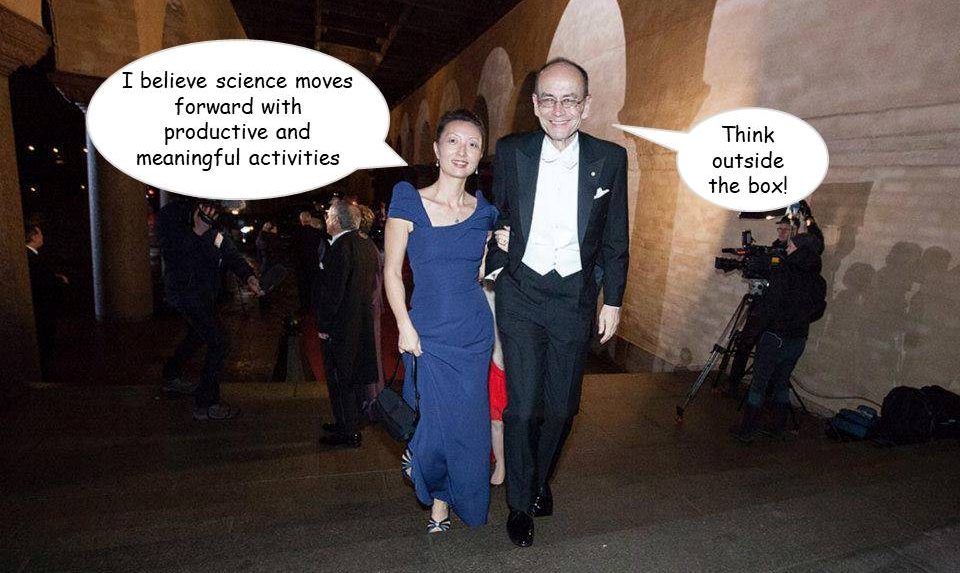
Südhof once famously said:
“In order to think outside the box, you need to have a box in the first place”
Well, maybe his and his wife’s lab do need a big box to store their research data in. So their lab members won’t have to think up improbable results outside the box.
Südhof’s wife Chen (“a brilliant scientist whose advice and insight into my work has been enormously helpful“) said on the occasion of his Nobel:
“Although both of us have the tendency to stay away from the limelight, we recognize the importance of communicating to the general public the value of science and value of truth.”
Maybe they should communicate this in their own labs as well.
Südhof and Chen both replied extensively, their statements at the end of this article. Stanford University was notified by Maarten van Kampen, but didn’t reply.
Bookkeeping?
By Maarten van Kampen
This post is about a topic I know close to nothing about: neuronal plasticity. The issues that will be addressed are however simple: bad bookkeeping by two related groups and what seems to be fabrication of data when challenged. This is in itself not uncommon, but here the group leads happen to be a Nobelist and his wife.
The post comes with a complication. The papers of the two groups have attracted close scrutiny on PubPeer, likely exactly because of the high profile of their group leads. Some 10 papers have been critically commented on in the last 6 months, with a significant number of the concerns (by my judgement) unfounded:
- Jacqueline Burré , Manu Sharma , Theodoros Tsetsenis , Vladimir Buchman , Mark R. Etherton , Thomas C. Südhof Alpha-synuclein promotes SNARE-complex assembly in vivo and in vitro Science (2010) doi: 10.1126/science.1195227
- Alessandra Sclip , Taulant Bacaj , Louise R. Giam , Thomas C. Südhof Extended Synaptotagmin (ESyt) Triple Knock-Out Mice Are Viable and Fertile without Obvious Endoplasmic Reticulum Dysfunction PLoS ONE (2016) doi: 10.1371/journal.pone.0158295
- Alessandra Sclip, Thomas C Südhof LAR receptor phospho-tyrosine phosphatases regulate NMDA-receptor responses eLife (2020) doi: 10.7554/elife.53406
[Note LS: In above papers, the authors occasionally justify their re-use of western blot data. Generally, scientists know better to avoid such image reuse and design experiments accordingly experiment for more data and more reproducibility]
When issues are found in a paper, then not all comments are on the mark because of the intricacies of the experiment. For example, in this 30-comment-long thread some apparent duplications are statistically expected. And also large blocks of duplicated data are not an error, but due to the use of overlapping control groups. In the end some six lines of data were found to be duplicated within and even between groups, see for example here. Plus a mismatch or two (or three) between the data and a published figures. This is just (too?) bad bookkeeping.
I incidentally got involved a week ago when pointing out the impossibility of a dataset in a running discussion on PubPeer. This “Retinoic acid” paper is the last topic of this post. Intrigued by the “spreadsheet detective” Oncodiscus sauridae I searched for his other contributions and found the Neurexin-2 paper. And I consider that paper, discussed right after the ‘Background’ below, a serious and noteworthy case.
Background
In the papers discussed here the researchers breed genetically modified mice and then cut their brains in thin slices. Next they perform measurements on electrical signal propagation within these brain slices and try to find out which genes, receptors, molecules, etc. are responsible for the changes observed.
Individual measurement results are fairly simple, see below:

Figure 5 F&G from Dai et al eLife 2022. Left: / panel F: current versus time traces, including zoom-ins on individual spikes. Middle / panel G: analysis results of (many of) these traces, plotting the mean spike frequency and amplitude. Right: numerical data included in the paper.
For each measurement a trace of current versus time is obtained (panel F). These current traces contain many spikes and the authors count the number of spikes in a given time interval to obtain a firing frequency. Also the amplitude of the spikes is determined to yield an average spike amplitude. The measurements are repeated on tens of cells and the authors then generate bar graphs showing the average firing frequency and amplitude (panel G).
The papers discussed here are published in journals that require or encourage their authors to also post the underlying data. The spreadsheet reproduced at the right contains all the individual frequency and amplitude measurements that are behind the bar graphs in panel G.
Neurexin-2 paper
The Neurexin-2 paper from the lab of Stanford University professor Thomas Südhof was called out on PubPeer in March 2023, only one day after its publication. The underlying data was found to show unexpectedly duplicated stretches of values in many of its tables, three of which are shown below:
Pei-Yi Lin, Lulu Y. Chen , Peng Zhou , Sung-Jin Lee , Justin H. Trotter , Thomas C. Südhof Neurexin-2 restricts synapse numbers and restrains the presynaptic release probability by an alternative splicing-dependent mechanism Proceedings of the National Academy of Sciences (2023) doi: 10.1073/pnas.2300363120
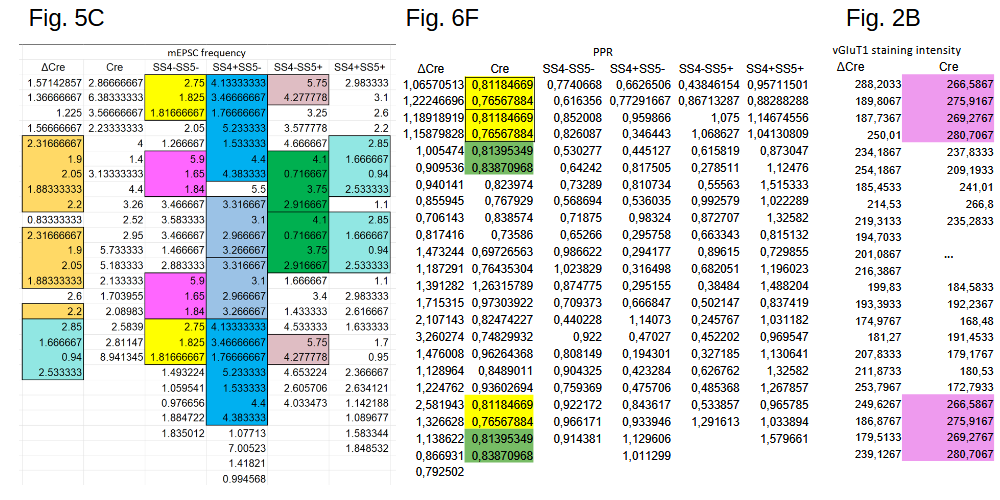
The numbers in the table of Fig. 5C represent firing frequencies, those in Fig. 6F the ratio of spike amplitudes (Paired-Pulse Ratio), and Fig. 2B shows staining intensities. The issues seem significant, e.g. about half of the data in the fourth column of Fig. 5C is duplicated.
The first author Pei-Yi Lin promptly responded on PubPeer, acknowledging part of the reported issues:
“We did not upload the latest version of our raw data but the preliminary data sheet, and I am very sorry about this mistake“
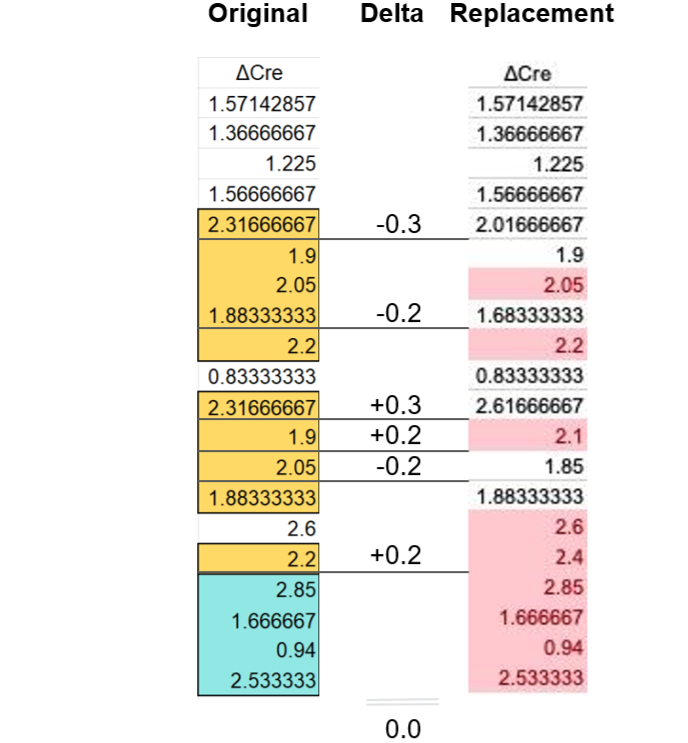
In the same response also the latest version of the data was included in the form of screenshots. And this is where the problem evolves from bad bookkeeping to possible fabrication. In the figure below I reproduced the original Fig. 6F concern (left), the author-provided replacement data (middle), and an analysis of the differences (right):
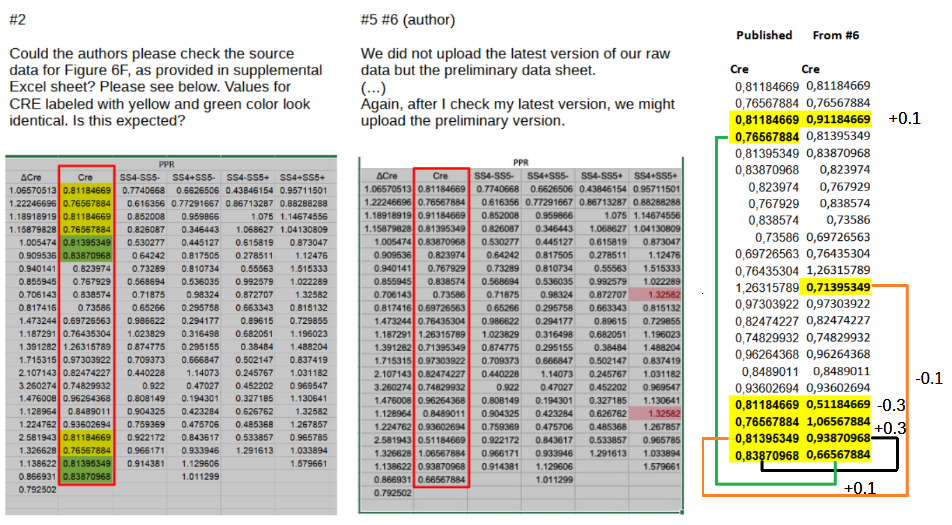
The differences between the as-published and corrected values are highlighted in yellow in the right panel. And they are remarkable. For one, the average Cre value in the original and corrected sets is identical in all its 15 decimals: 0,835768218260869. I made an attempt to calculate the probability of this happening by chance and came to a one-in-ten million number. And then the statistics sleuth Nick Brown noted that the corrected values are simply 0.1 or 0.3 larger or smaller than the original ones (right). This is an extreme coincidence and seems to point at data fabrication.
A similar story holds for the duplications in Fig. 2B, shown in purple in the figure left below. After notification the author acknowledged the problem and uploaded a screenshot of the latest version of the data, right panel below:
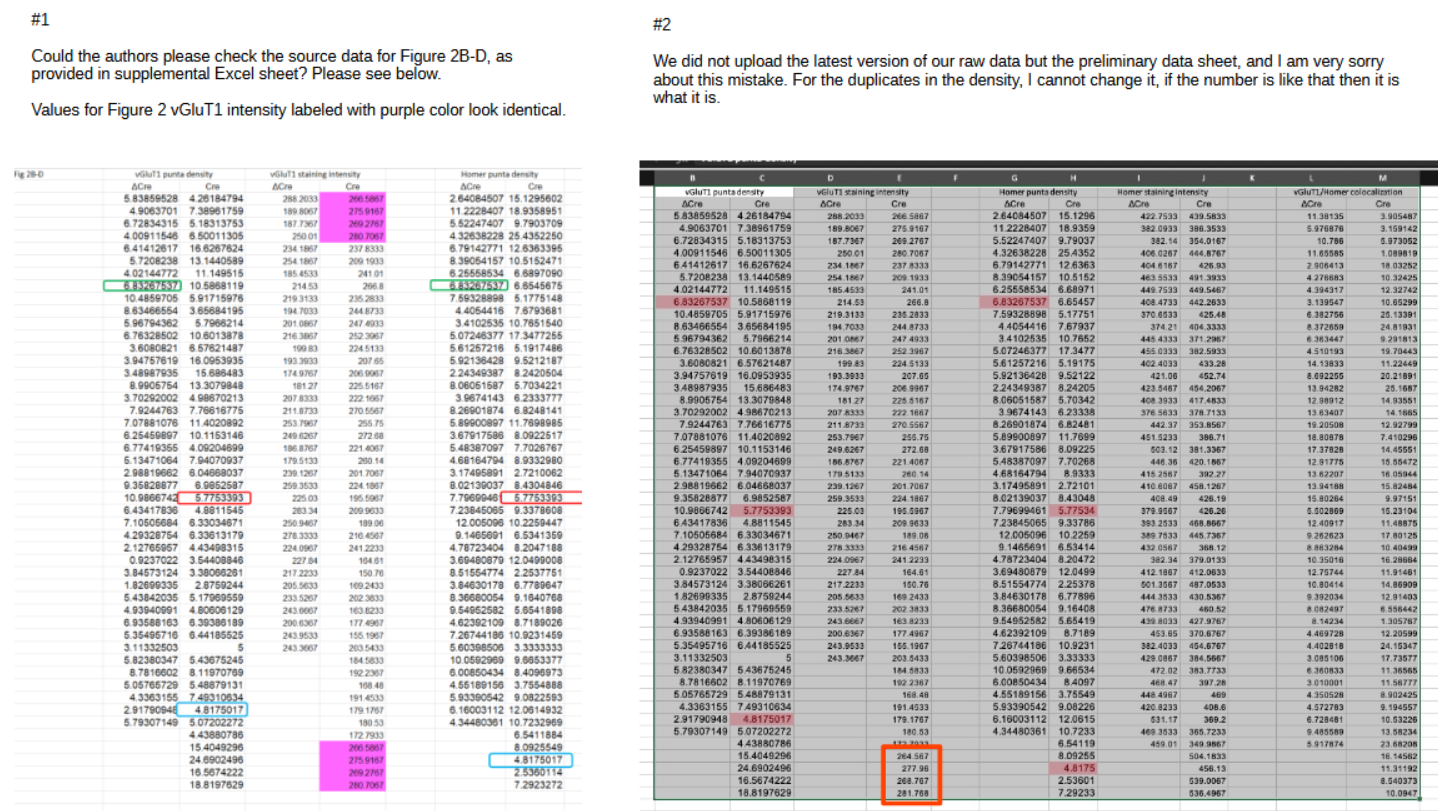
The difference between the published and latest version is minimal, with only the bottom repeated stretch replaced by new values (red rectangle). And these replacement values turn out to be extra-ordinary:

In the figure above I have plotted the CRE values as function of their row number. The measured values show a large spread of approximately ±60 around their mean of 220. OF note: the plotted values should have no relation with their row number.
The original duplication can be recognized in the blue dots, with the last four dots being identical to the first four dots. The newly corrected values in red show a surprise: they are near identical to the published data, differing by close to -2, +2, -0.5, and +1. Despite the large variability in CRE the newly recovered replacement values strictly follow their published counterparts, showing the same ‘jump’ at row 45. This is extremely unlikely to have happened by chance and appears to point to a non-measurement origin of corrected values.
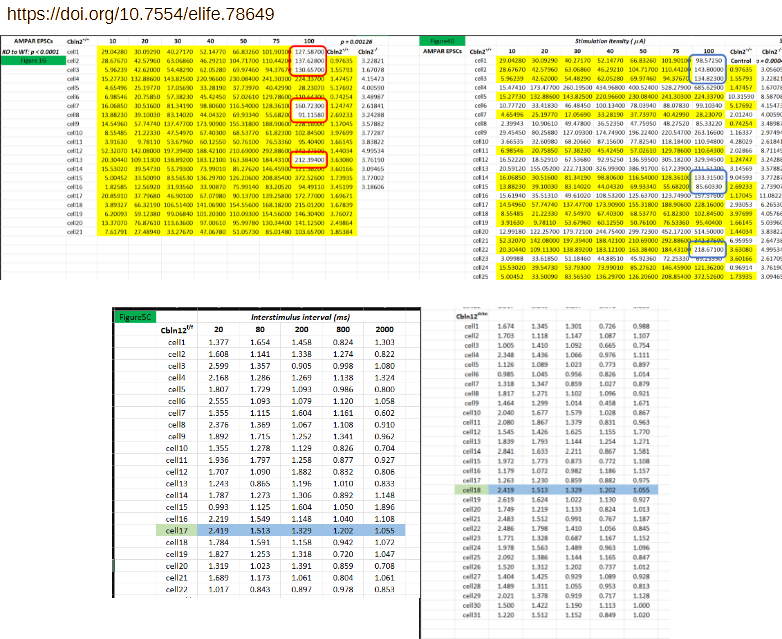
There was more of an argument over the repeating stretches of frequency data in Fig. 5C, reproduced below (left):

The author PY Lin replied on PubPeer, correctly remarking that it is far more likely to see repeated sequences in this type of data:
“The critic is mistaken in her/his criticism. We realize that in today’s scientific environment, many techniques may be difficult to understand, but in this experiment, the frequency is the number of spontaneous response events in a certain fixed period of time, so it is easy to have duplicates even cross the groups as shown below.”
For the connoisseurs: Leiocephalus raviceps tried to estimate the actual probability of a repeated 6 value sequence, taking into account the specifics of this frequency measurement. Finding it to be close to one-in-a billion, he pointedly remarks that “this is likely to be the most significant result in the article“. His work is however void now, as the author supplied a brand new table with frequency values. And this correction wholesale removes all repeated sequences, see the right panel in the figure above.
Using OCR it is fairly easy to transform the image of the table back into a spreadsheet. And that leads to familiar finds. Let’s start with the first (ΔCre) column:
The ΔCre replacement data nicely eliminates all repeated sequences, but does so by adding or subtracting 0.3 or 0.2 from six of the as-published values. The sum of these differences is 0, hence the mean of the ΔCre column remains unchanged. This looks like a carbon copy of the Fig. 6F correction discussed above and should not have happened by chance.
The mean and even the standard deviation of three other columns remain identical after the correction:
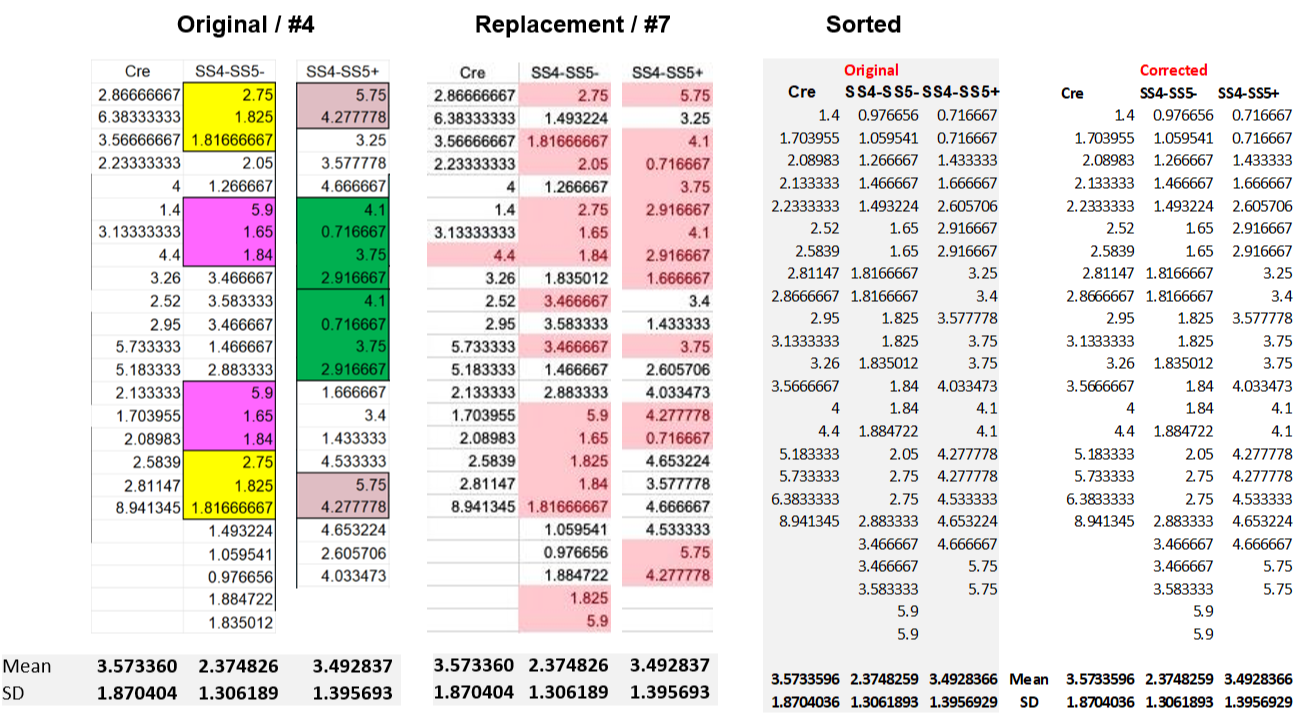
The original Cre column did not show duplicated sequences and is incidentally the only one to remain unchanged after correction. The correction does change the SS4-SS5- and SS4-SS5+ columns, again eliminating all repeated sequences. Looking in more detail it turns out this is done by changing the order of the values in these columns. This can be best seen when the values are sorted, right panel above: the sorted original and corrected data are simply identical. It is obvious that addressing concerns on the improbability of repeated sequences by randomizing the order of values is not genuine.
For completeness: the corrected last column is also re-shuffled and has an extra 2.85 Hz entry added. And for the SS4+SS5- frequency column the corrected values are different. Not by very much though: the sum of the column values differs by exactly 1 between the versions.
Apart from the above three issues acknowledged by the author there are another six (or so) sets of repeated sequences reported in the PubPeer post that the author has yet to respond to. This adds to the concern of very poor bookkeeping.
The errors do not only affect the uploaded underlying data: errors in the published data appear to be 1:1 reflected in the published figures. This can for example be seen in Figure 6B below, showing the frequency data discussed before:

Overlaid on the figure one can see in blue the as-published ‘preliminary’ frequency data and in red the author-provided ‘corrected’ data for the fifth column (‘values changed’ SS4+SS5-). It is clear that the figure represents the preliminary data, lacking many points (open circles) between 2 and 3 Hz.
The first author appears not to be taken aback by this all, and recently posted:
“Thank you for your comments. We will check our data files for errors and make corrections as needed.”
I am at loss to explain what happened here. It appears as if a post-doc thought it best to respond to substantiated concerns on large parts of the published data by fabricating better-looking results. And this one day after publication of the paper. If true, this also raises the question as to why the author did not simply provide the actual, still very fresh data.
Lab output
Researchers from the same lab have by now acquired a small PubPeer record for duplications in the underlying data they shared with their papers:
- Jinye Dai, Christopher Patzke , Kif Liakath-Ali , Erica Seigneur , Thomas C. Südhof GluD1 is a signal transduction device disguised as an ionotropic receptor Nature (2021) doi: 10.1038/s41586-021-03661-6
- Jinye Dai, Jason Aoto , Thomas C. Südhof Alternative Splicing of Presynaptic Neurexins Differentially Controls Postsynaptic NMDA and AMPA Receptor Responses Neuron (2019) doi: 10.1016/j.neuron.2019.03.032
- Christopher Patzke , Marisa M. Brockmann , Jinye Dai, Kathlyn J. Gan, M. Katharina Grauel, Pascal Fenske , Yu Liu , Claudio Acuna , Christian Rosenmund , Thomas C. Südhof Neuromodulator Signaling Bidirectionally Controls Vesicle Numbers in Human Synapses Cell (2019) doi: 10.1016/j.cell.2019.09.011
- Jinye Dai, Kif Liakath-Ali , Samantha Rose Golf , Thomas C Südhof Distinct neurexin-cerebellin complexes control AMPA- and NMDA-receptor responses in a circuit-dependent manner eLife (2022) doi: 10.7554/elife.78649
The above papers have a common coauthor, Jinye Dai, former postdoc at Südhof lab and now assistant professor at Icahn School of Medicine at Mount Sinai. The issues appear less extreme than discussed above and may be partially related to the heightened scrutiny the group has received on PubPeer. Also note that not all concerns raised in the threads above are valid.
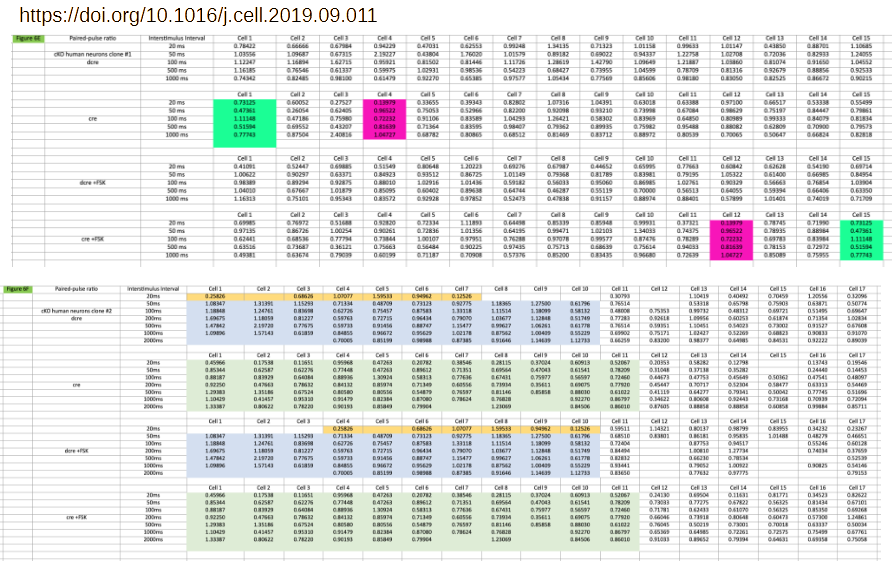
Still, the selection of (author-confirmed) issues listed below should not happen. The majority of them is explained by the authors as ‘copy-paste errors’. This suggests a very convoluted and manual workflow where the authors copy large amounts of data line-by-line from some data source to Excel sheets.

Take as an example concern #6 by Elisabeth Bik regarding Dai et al 2019, reproduced below (bottom-left). The affected worksheet alone contains nearly 200 lines of data. Two of these lines are duplicated, in one case even between conditions. The issues are acknowledged as copy-paste errors. The spreadsheet itself consists of 16 of these worksheets, with Bik identifying similar issues in another two of them. Did the authors indeed manually copy-paste some 2000 lines of data one-by-one, while trying to keep track of experimental groups, cell number, etcetera?


Retinoic acid paper
In June 2023, the PubPeer user Oncodiscus sauridae commented on this paper from the lab of Stanford professor Lu Chen (who is the wife of Thomas Südhof):
Shruti Thapliyal, Kristin L Arendt , Anthony G Lau, Lu Chen Retinoic acid-gated BDNF synthesis in neuronal dendrites drives presynaptic homeostatic plasticity eLife (2022) doi: 10.7554/elife.79863
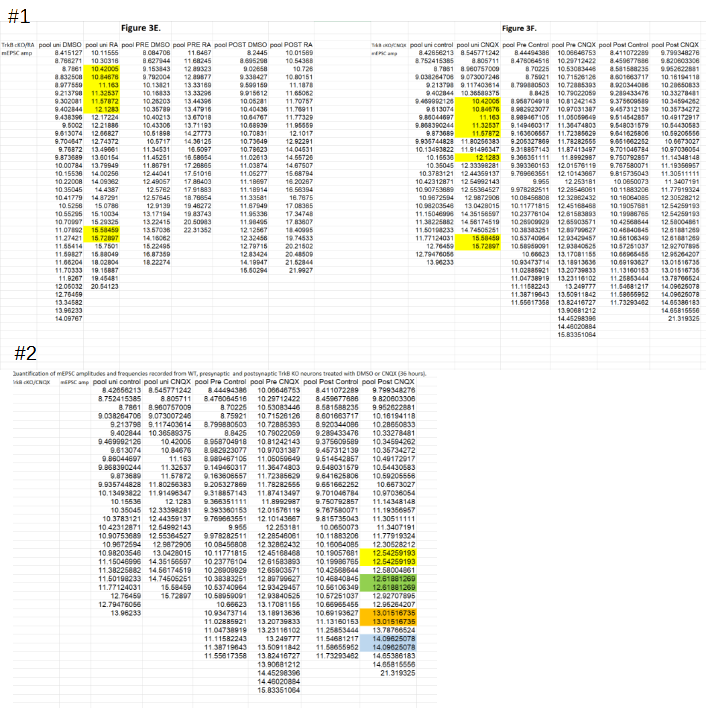
The PubPeer user noted that two figures unexpectedly shared eight ‘spike amplitude’ values despite belonging to different experimental groups (#1 below). Additionally, a number of amplitude values appeared to be duplicated in a single experimental group (#2).
The senior author Lu Chen promptly responded, acknowledging that the duplications in #2 are the result of a copy-paste error:
“…we copied and pasted before we sorted the amplitude and frequency data so we did not catch the mistake then. […] The conclusions of our experiments remain unchanged.”
Chen also announced to “submit the errata to eLife shortly“. Surprisingly, the issue reported in #1 was not acknowledged. Instead, the authors went back to their original data and produced the following:

For each of the eight duplicates flagged in #1 the authors found that the spike amplitudes were actually different. They only appeared identical in the published data (yellow columns) because there the values were rounded to five decimals behind the decimal point. However, when looking at the extended decimals (red rectangles) differences are apparent1. To exclude any mistakes, the authors also looked at the firing frequency that is determined for each of these measurement. And these frequencies differ ‘vastly’ between Figs. 3E and 3F (green rectangles), again showing that the measurements are unique. Dr Chen explained on PubPeer:
“The answer to your first question regarding mEPSC amplitude data being identical across different cells and different experiments is simple: they are not.
The appearance of identical data is caused by the cutoff (rounding) after five decimal points. The spread sheet attached here show all the highlighted data under question, with the rounded data (5 decimal points) on the left (columns B and F), and fully extended original on the right (columns D and H). As you can see, they are different number originally, only made to look the same because of rounding by Excel. For full transparency, we also provided the mEPSC frequency data for each of these cells in columns C and G. In each and every case, the cells that appear to have the same amplitude have vastly different frequency data, becasue they are indeed different cells.”
The above is a very troublesome. The eight duplicated values are identical in all their seven published digits. Since the first digit is always 1, this leaves 6 unique digits. Quantization effects can be ruled out by the extended decimals data of the authors: their data clearly shows that the minimum difference between values can be as low as 0.0000022 . Given the above the chance of finding a single pair of identical values is about 10-6. And the chance of finding 8 or more matching pairs between two columns having some 30 elements each is improbable to a level of 10-36. This corresponds roughly to winning the American MegaMillions lottery four times in a row3. Or, as Leiocephalus raviceps would say: “this is likely to be the most significant result in the article“.
The authors gave the above a thought, and Dr Chen wrote (highlight mine):
“Thank you for your intense interest in our data.
If you are questioning how likely it is that two cells from the same study have average mEPSC amplitudes identical to a few places after the decimal point, my answers are below:
Likely? Probably not. Impossible? No.
[…]
We can spend days and weeks going through all data sets from our and other labs’ experiments and generate simulations to argue and debate the likelihood or unlikelihood of such occurrence. I am not going to do that here because I believe science moves forward with productive and meaningful activities. We have provided evidence that these are indeed from different cells with different amplitude and frequency data“
Since I strongly dislike impossibilities happening I went more carefully through the authors’ data, finding even more improbable coincidences.

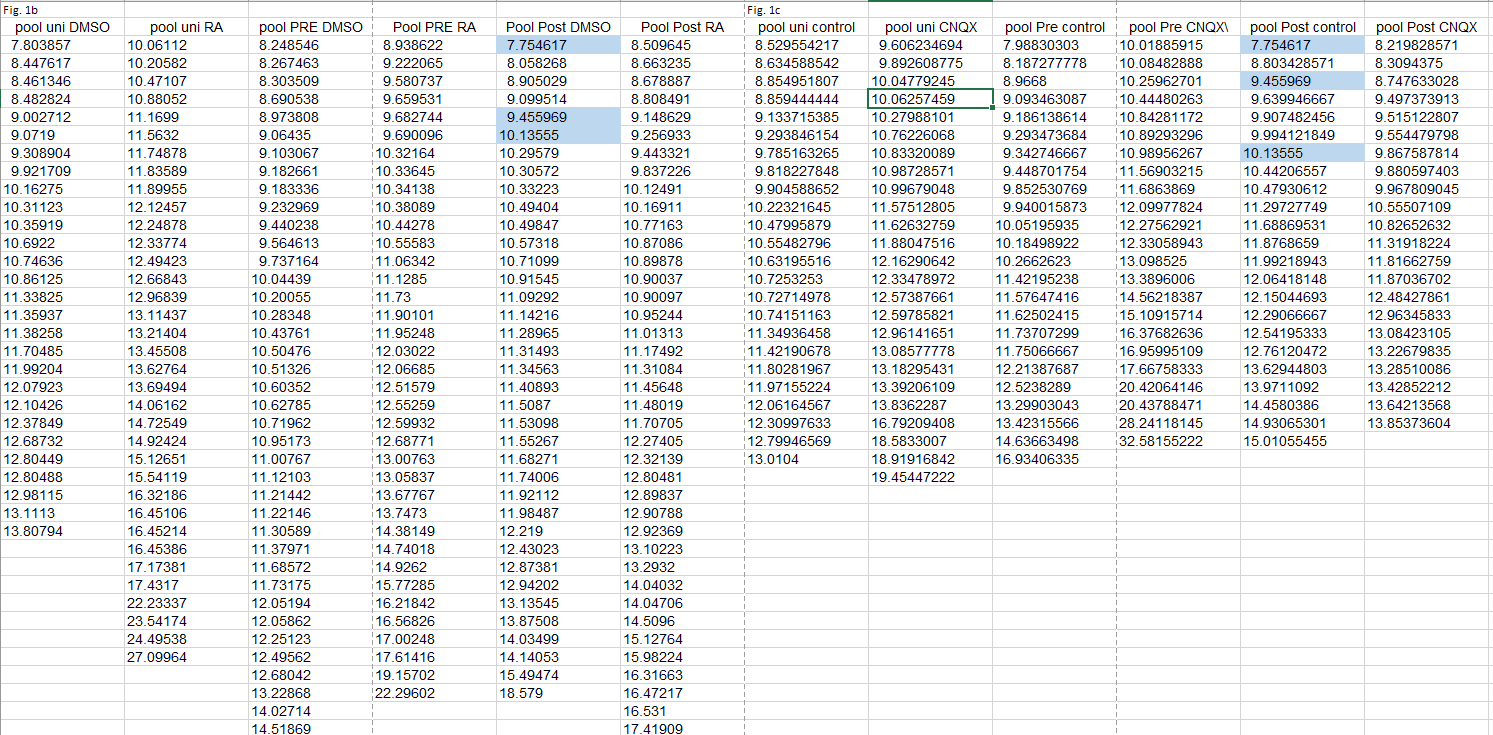
For starters, the 8 duplicates identified in #1 turned out to be triplicates (orange highlights). And there was another set of 7 triplicates to be found (yellow highlights). Plus another 3 duplicates in Figs. 1b and 1c (blue). The duplications and triplications inexplicably ‘stick to their columns’, with the first and second columns affected for Figs. 3 and the fifth columns for Figs. 1. Finally, the triplicated values are often out-of-place in their column, showing a lower number of decimals after the point. This is especially true for the orange values, having 5 digits after the point. In Fig. 3C, reproduced below, the orange triplicates sit in a column with the other values having 7-8 digits after the point. Note that also the yellow values are clearly out-of-place in their column.

The above all adds up to one explanation: the authors did make many more copy-paste errors in their published dataset. This seems to leave the authors in a very awkward position, as on two occasions they stated to “have provided evidence that these are indeed from different cells with different amplitude and frequency data“. And in fact claimed to have shown exactly this in a detailed table that presumably reflects data from their primary source.
Despite the above, Dr Chen seems confident that that more correct data can be found:
“Noted. Thank you. We will check and correct all copy-paste errors and send an updated version to the publisher.“
To be clear: the issue here is just bad bookkeeping and insisting that the published data is correct.
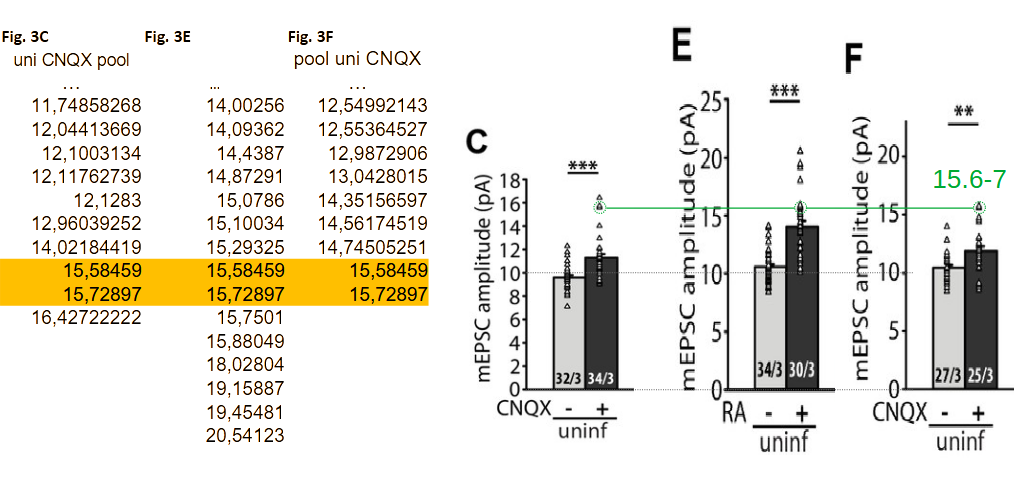
It is important to note that, like for the Neurexin-2 paper, the published figures and (likely) conclusions have been based on the wrong values. This can be seen in the figure below where Figs. 3C, 3E, and 3F are reproduced using an identical vertical scale. The data table at the left highlights triplicated 15.6/15.7 pA values; these values are clearly ‘shared’ between panels C and E (green circles). The unrelated ‘in-between’ RA+ group then shares 8 of its 30 data points (>25%) with the flanking ‘CNQX+’ groups. This level of contamination has the potential to alter conclusion.
The current scrutiny can only identify duplications in- and between groups. Given the extent of the copy-paste errors it stands to reason that the data may also be affected by values copy-pasted to wrong groups.
Conclusions
The workflow of the two groups appears to contain a lot of error-prone copy-pasting. In the papers investigated in detail (Neurexin-2, Retinoic acid) the erroneous data submitted with the papers was also used to produce the figures. And hence likely used to draw conclusions on the (significance of) the effects observed.
The first author of the Neurexin-2 paper appears to have attempted to alleviate the raised concerns by providing fabricated data. The last author of the Retinoic acid paper has tried to alleviate concerns by providing primary data that (to the best of my knowledge) cannot be correct. If confirmed, this would raise additional concerns on data curation.
Footnotes
- The differences between the 3E and 3F amplitude values listed in the author-provided table are minimal, with 3 pairs of peak amplitudes having a difference smaller than 2×10⁻⁶ pA. Let’s try to get some feeling as of what this means. A typical ‘spike’ current-versus-time trace is reproduced in the figure below. It has a ~10 pA peak amplitude and lasts some 20 ms. The amount of charge in one such a pulse is given by the area below the curve and corresponds to ~6×10⁵ electrons. A difference of 2×10⁻⁶ pA in peak amplitude corresponds to a difference of just 0.1 electrons in the charge emitted by the neuron. 0.1 electrons can safely be considered deeply buried in the noise of these measurements, making the many peak amplitudes ‘matching’ to within a fraction of an electron intriguing.
- The minimum difference between as-published amplitude values is 7×10⁻⁶ pA. Being an experimental physicist I also have some feel as what to expect. The authors measure 10 pA peak currents, which would be done on an at most a 100 pA full range scale. Signals vary slowly (kHz), so one should easily be able to digitize to 16 bits. This yields a digitization step size of 10-3 pA. The authors take ~100 s long traces and record some 100 spikes. The average peak amplitude then would have a digitization step of 10-5 pA, close to the 7×10⁻⁶ pA mentioned above. This is for the most simple approach. Tricks like oversampling or fitting the decay of the spike can result in a significantly smaller digitization step size. [2023-06-28] Also, the peak amplitude is the difference between the peak value and the baseline before the peak. This baseline is likely determined for every peak by taking an average over a number of points. Even using only 10 points will reduce the above step size to 10-6 pA. Maybe the authors average the peaks first (as in the figure below) and then determine the baseline over 10 points. This give the same result.
- I am not at all a statistician and the above estimate is certainly a somewhat flawed simplification. For example, in practice Oncodiscus sauridae checked for matches between the 28 columns in the Fig. 3 datafile. This gives some 28*27=~1000 combinations, increasing the probability of finding 8 matching pairs between between two arbitrary columns to 10-33. This is about 10x more likely than winning the Mega millions lottery 4 times (10-34). And maybe our 6 unique digits estimate was to optimistic and we should have reduced it to only 5. This would yield an “8 matching pairs between two arbitrary columns” probability of 10-25, or winning that lottery ‘only’ 3 times in a row. Or we could look at standard deviations of the values, which vary between 1 and 4 pA for the different groups. It is most likely to find a matching value for the group’s actual mean. With a 1 pA standard deviation the probability of finding a match within ±10-5 of the mean (6 unique digits) is ~10-5. This then brings us again to the 10-25 probability, three national lottery wins in a row. Whatever the exact probability of this coincidence, it is utterly, negligibly low.

Addendum by LS
The data irregularities also affect western blot data. Like this, mentioned above:
Alessandra Sclip , Taulant Bacaj , Louise R. Giam , Thomas C. Südhof Extended Synaptotagmin (ESyt) Triple Knock-Out Mice Are Viable and Fertile without Obvious Endoplasmic Reticulum Dysfunction PLoS ONE (2016) doi: 10.1371/journal.pone.0158295
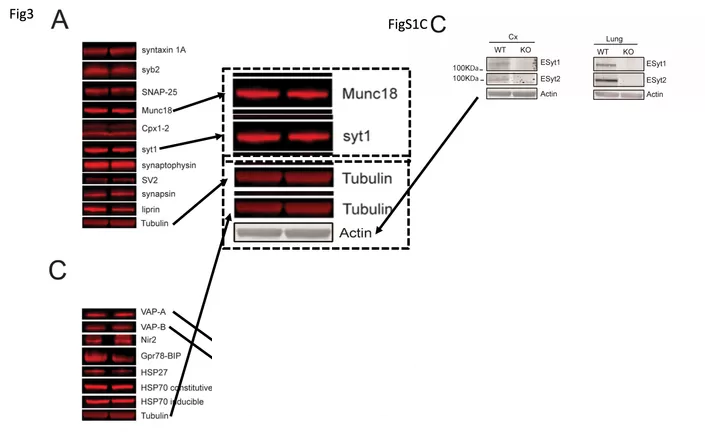
In December 2022, Südhof explained on PubPeer that “the tubulin blots are the same for Figure 1C and Figure S1C, since -as described in the paper!- they were derived from the same experiment“. If true, it’s amazing how many primary antibodies his lab is able to apply to one single piece of blot membrane and still obtain a meaningful read-out. In another paper with same first author, Sclip & Südhof 2020, Alessandra Sclip managed to successfully probe the same blot with FOURTEEN primarily antibodies. Or so she and Südhof say. For the above paper, Südhof also uploaded raw data and declared:
“The other bands, however, are different and have different shapes.“
Yet they were identical.

In the following Nature paper, the published bar diagram does not seem to reflect the actual western blot result it was supposed to be based on.
Jinye Dai , Christopher Patzke , Kif Liakath-Ali , Erica Seigneur , Thomas C. Südhof GluD1 is a signal transduction device disguised as an ionotropic receptor Nature (2021) doi: 10.1038/s41586-021-03661-6


The first author Jinye Dai explained that “unfortunately, we mislabeled the full blots in the Supplementary Data” and announced to submit an erratum to Nature. Yet it was even weirder.


It seems though, Bik was somewhat mistaken, the whole GluD1 blot in Fig 3a does faithfully correspond to Fig S1b. But the blot image was digitally cleaned up to remove spots and imperfections. Not good practice, but not fraud either. Here an overlay:
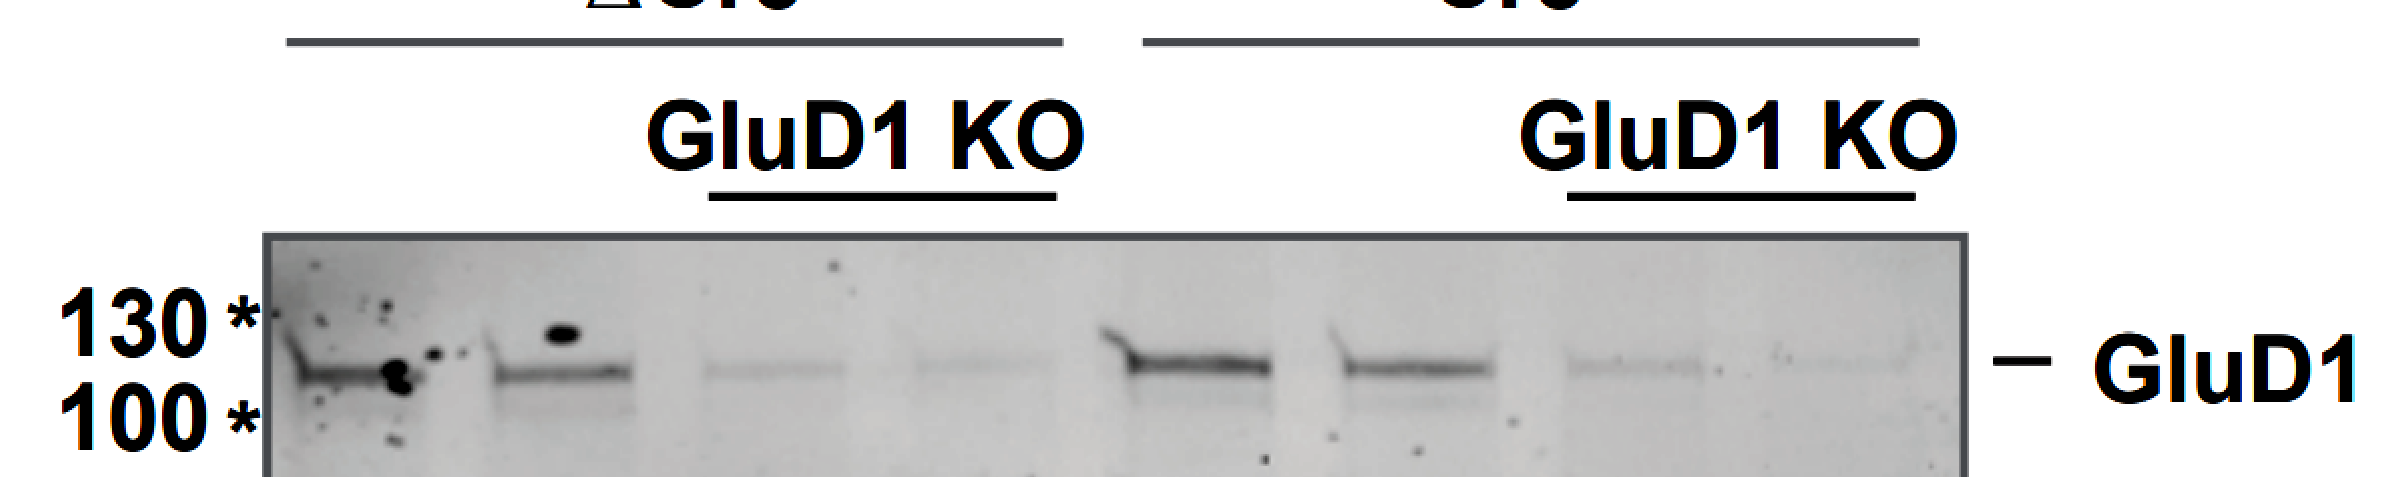
Still, it seems the first author panicked when questioned on PubPeer and created a replacement raw data which just isn’t real. Dai’s new Tuj1 blot lacks all background signal and it only partially matches the published Tuj1 data. An overlay:
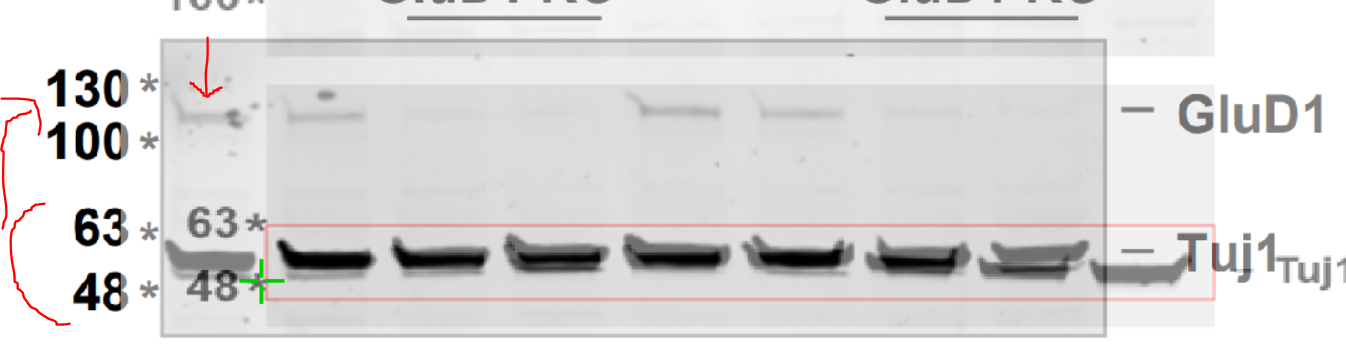
Basically, as we saw above with Pei-Yi Lin, another Südhof mentee Jinye Dai apparently reacted to criticism by providing elaborately fabricated replacement raw data. The initial concerns may not have been very serious, but the reaction is certainly troubling. Do they react in other situations like this? E.g., when dealing with critical peer reviewers or in fact, with their own critical PI? In which other situations do they return with fabricated replacement results? How many other lab members behave like that? This all should be very worrying to Südhof. Except it isn’t.
Now, full and unedited replies by Thomas Südhof and Lu Chen to the PubPeer allegations.
Reply by Thomas Südhof:
Yup we are being hounded.
Some of the repeated data in the excel files are copy-paste errors in assembling excel files after papers have been written and figures made from the original data. The PubPeer hounds don’t understand that these files are assembled by copy-pasting the original data after a paper has been accepted and are not the source files – such copy-paste errors easily occur if the ‘copy’ function is not pressed adequately. What the PubPeer hounds also don’t understand is that another set of data are repeated numbers because of the nature of the primary data which are non-continuous and so, when quantified per unit (such as mini-frequency per time) can only have repeated numbers.
All this is obvious when you look at the data files – just scrutinize at where the repetitions occur. My people didn’t check the excel files for repetitions before they submitted them, nor did I – which was a grave oversight. The data files are assembled by non-overlapping teams of people, not the same scientists, and there is no fabrication, but inexcusable sloppiness.
Moreover, my lab and the Chen lab are not connected but are separate without overlap.
The degree of malice and the lack of understanding of how data are reported are depressing. Of course these copy-paste errors shouldn’t have happened – people should have checked the files for repetitions.
Finally, let me just comment on the implausibility of the accusation of fabrication you made: I worry about fabrication all the time, I look at all the original data (which unfortunately are not the excel files in the incriminated papers that I did not look at because they are assembled after a paper is accepted and not used for the paper). But what I worry about is NOT that somebody copy-pastes the same data on purpose, what I worry about is that someone makes up data. This is not detectable by the straightforward screen for repeated numbers in excel files (which we should have done), and this is why I want to see all original traces.
I hope this helps. The number of unsupported and malicious accusations of fabrication we have to deal with now is truly depressing – just look at the last real accusation we faced on data fabrication (not the number repetitions) – the accusation that a blot was duplicated where a former postdoc thankfully could actually find the original blot and show it was not duplicated. Afterwards the PubPeer accuser criticized the low resolution of the blot as though this is something we cannot control but is in the hands of the journals – where are we going with this? Stop the next generation of scientists because they are squeezed on the one hand by fabricated accusations and by universities and government regulations on the other hand?
Südhof’s statement that the alleged raw data published online was actually generated by “assembling excel files after papers have been written and figures made from the original data” is puzzling at best. He reiterated this again in another email:
“we are facing fraud accusations because of duplications in data tables that are assembled after a paper has been completed, not questions about the actual data.”
I will let his neuroscience peers figure out what to make of such procedure to handle and share raw data.
In his last paragraph above, Südhof referred to Barre et al Science 2010:
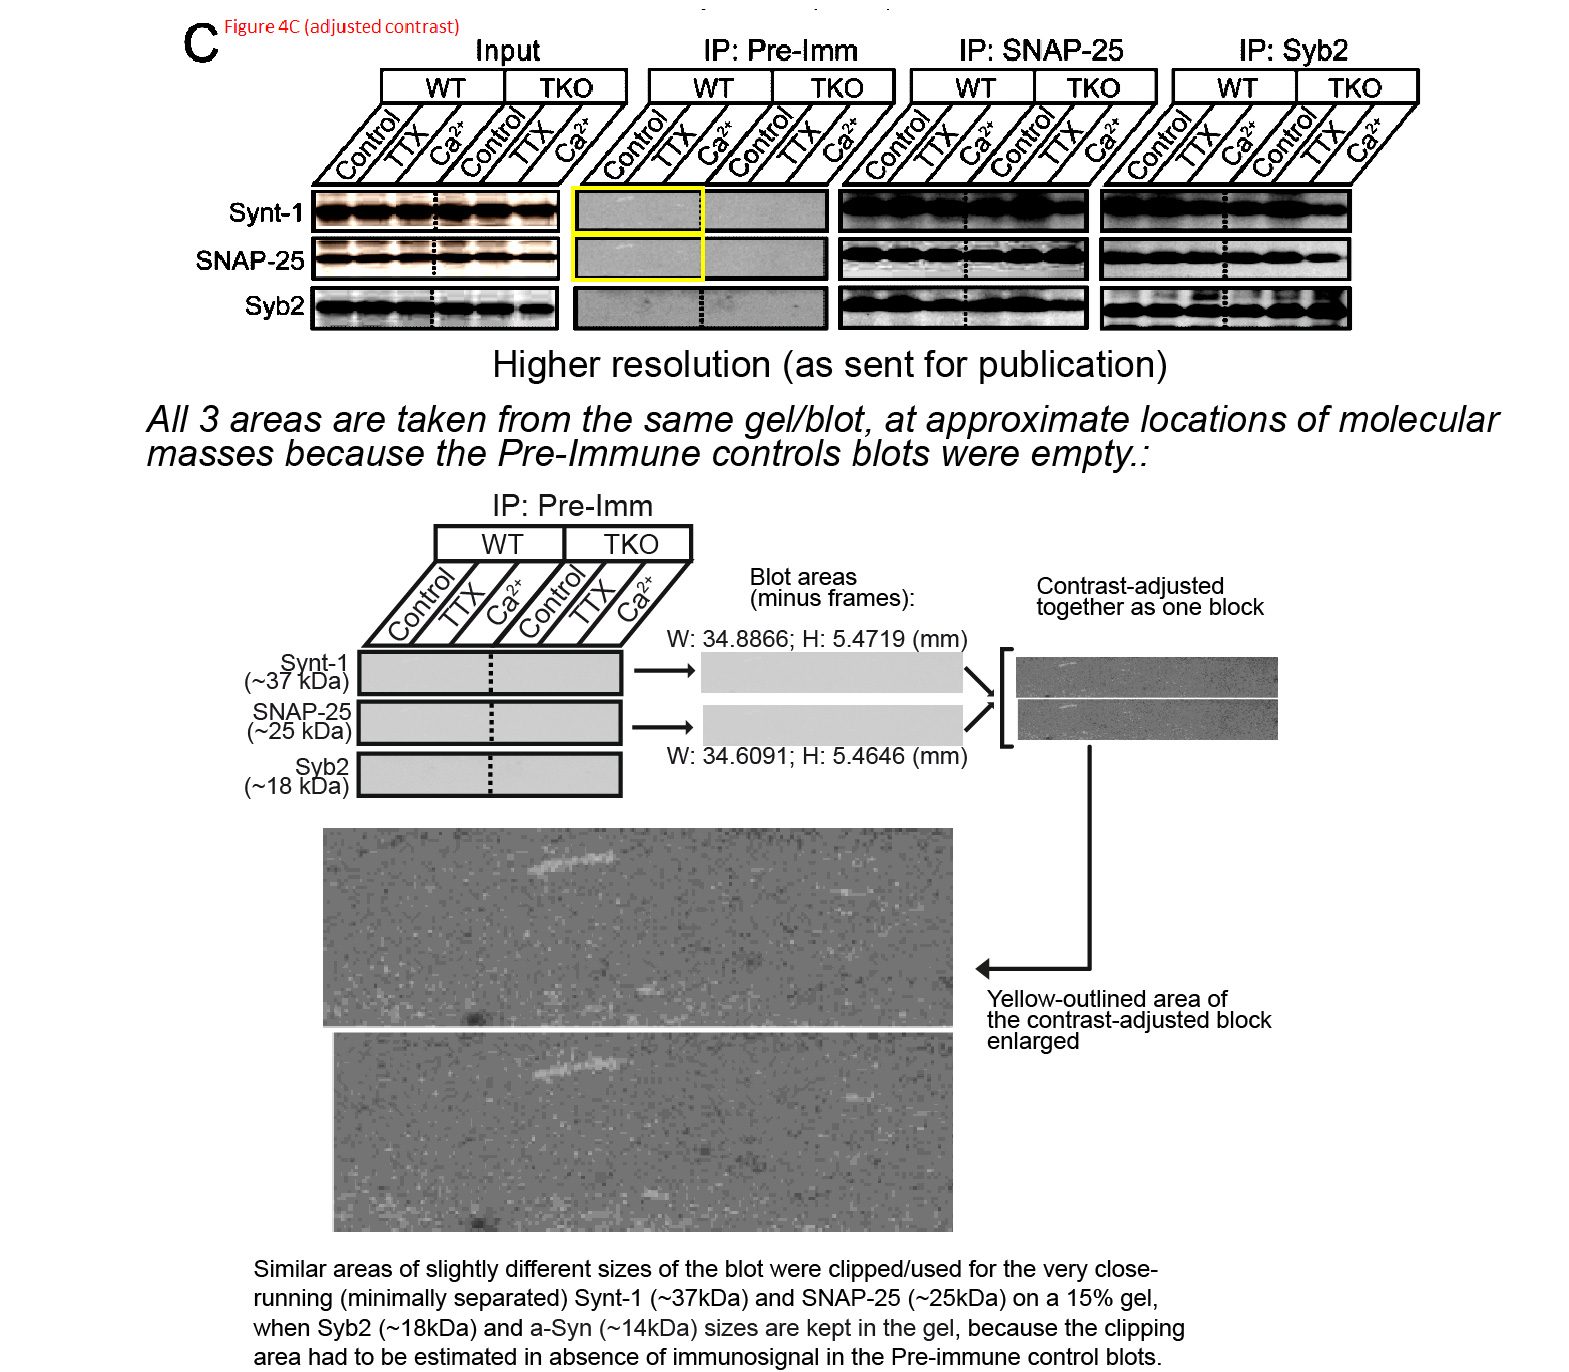
The first author Jacqueline Burré explained that “All 3 areas were taken from the same gel/blot at approximate location of molecular masses because the Pre-Immune control blots were empty“. First of all, the molecular weight of Synt-1 is 33 kDa and of SNAP-25 it is 25 kDa. Similar, but not that close, so the the shown region probably doesn’t cover both signals. Second, since the blot was presumably probed with Synt-1 and SNAP-25 antibodies sequentially (nobody does this simultaneously), the image of the membrane is unlikely to remain exactly identical after stainings. In any case, in such experiments scientists usually include an additional positive control sample, simply to know where to search for the signal. Which, it seems, the authors did not do, one can call this sloppy.
Reply by Lu Chen:
“First of all, as Tom already stated, our labs are not connected but conduct independent research.
Second, the fact that you, as an independent scientific journalist, noticed this recent trend of activity on PubPeer and contacted us for your investigation, proved to me that whoever are behind these accusations have achieved their goal – to drag the names of our labs through mud with unfounded accusation and malicious insinuation. They are successful in doing so because they try to make you and others to believe that making unintentional mistakes is unforgivable, and anything that is not perfectly clean in science must be fabrication and fraud.
The one paper from my lab that is under question has made a few copy paste errors that happened when data collected and analyzed from one file format were copy and pasted to a separate new spreadsheet to be reformatted for figure plotting. We have acknowledged the errors and are in contact with the journal editorial team to send in the errata. These errors, however, do not change the conclusions of the experiments. The other data sets being accused of duplication are not duplication at all, but very different data. I have explained it clearly in my response to the accusers and showed them that when we expand the digits after of the decimal point, these numbers are not the same any more. Moreover, the ‘frequency’ (another independent measure of the same data from the same cells) associated with these so called ‘identical amplitude’ data are vastly different from each other, providing unequivocal evidence that these data are not from the cells that we used in duplication, but different cells collected from different experiments.
Did we make mistakes? Yes we did. We acknowledge them and we correct them. Every journal has errata for a reason, because we are human and we may make mistakes.
Did we fabricate data and falsify results? Absolutely not. I said this in my response at PubPeer already and I am going to say this again here. Let me make one thing clear: I trust the colleagues I work with and their scientific integrity, not with a probability, but with certainty and fully. I stand by this statement yesterday, today and tomorrow.
In real life, when one is on trial, one gets to face the accuser – no one hides behind an anonymous screen. What we are dealing with here is anonymous attackers who cannot be held accountable for their actions and whose intention is not to seek what is true in scientific publication, but (as depressing as it is) destroying reputations of labs and the careers of the trainees in these labs. Science is what I do for life, not a means to power or wealth. This is also true for some of the trainees in my lab. So you can probably imagine how deeply hurtful this last weeks of experience is for them and for me. If careless but honest mistakes can be used to generate a whole series of wrongful accusations to discredit a lab and all their work, if fear of making mistakes prevails and paralyses creativity and daring attempts to make discoveries, where do you think the future of science will be? What career choices will our young trainees make?”
Chen neglects the fact that Elisabeth Bik is not anonymous. And neither is Maarten van Kampen, who previously informed Stanford of the issues. In another email, Chen added this:
“If being at a visible university makes us targets of internet trolling, then there are only two things we can and should do. First, better ourselves, do our best to find out how mistakes can be made and avoid them at all cost. Second, time will tell truth from fraud. Keep steady at our course and pursue scientific investigation with integrity but without fear of making mistakes. Scientific discoveries are never made with fear of being wrong, but with courage and persistence of approaching truth with trial and error.”
Internet trolling by malicious PubPeer hounds? Hounded by anonymous internet trolls seeking to paralyse creativity and to stop the next generation of scientists?
On the topic of poor judgement: Thomas Südhof is board member of Elysium Health, an anti-aging supplement business run by the very questionable scientists Leonard Guarente and David Sinclair. Those are being trolled and hounded also.

The original sins of Leonard Guarente
“Without specific and credible allegations of research misconduct, MIT is unable to take any action.”
I thank all my donors for supporting my journalism. You can be one of them!
Make a one-time donation:
I thank all my donors for supporting my journalism. You can be one of them!
Make a monthly donation:
Choose an amount
Or enter a custom amount
Your contribution is appreciated.
Your contribution is appreciated.


Further reading:
https://forbetterscience.com/tag/nobel-prize/
LikeLike
Fascinating insight into human behaviour,
especially about providing fabricated data in answer to criticism of the published data!
LikeLike
Rebuttal to the Claim by Thomas C. Südhof that “In order to think outside the box, you need to have a box in the first place”
Abstract:
This rebuttal challenges the claim put forth by Thomas C. Südhof that a figurative “box” is necessary for thinking outside of it. By examining the nature of creativity, problem-solving, and the human mind, this paper argues that the concept of a mental “box” may not be a prerequisite for innovative thinking. Various examples from the fields of science, arts, and technology are presented to demonstrate instances of breakthrough thinking that occurred without predefined boundaries. The rebuttal concludes by acknowledging the potential usefulness of conceptual frameworks but highlights the capacity of human thought to transcend these frameworks and innovate beyond existing boundaries.
Introduction:
In a recent statement, Thomas C. Südhof proposed that a cognitive “box” is a prerequisite for thinking outside of it. While Südhof is a highly esteemed neuroscientist, this rebuttal aims to challenge the validity of his claim by presenting evidence from various domains that suggest the human mind is capable of transcending preconceived boundaries, thereby rendering the need for a mental “box” redundant.
Unconstrained Creativity and Problem-Solving:
Creativity and problem-solving are not necessarily dependent on the existence of a predefined conceptual framework. Many groundbreaking innovations throughout history have emerged from individuals who defied conventional thinking and surpassed established boundaries. Examples include Albert Einstein’s formulation of the theory of relativity, which revolutionized our understanding of space and time, and Jackson Pollock’s abstract expressionist paintings, which challenged traditional artistic techniques. These achievements demonstrate that innovation can arise from unbounded thinking, without the need for a preexisting “box.”
Empirical Evidence:
Psychological studies and neuroscientific research have also shed light on the capacity of the human mind to generate innovative ideas without a predetermined cognitive framework. For instance, the concept of divergent thinking, as studied by Guilford (1950), emphasizes the ability to generate multiple creative solutions to a problem. This form of thinking encourages individuals to break away from conventional constraints and explore novel possibilities. Moreover, neuroimaging studies by Beaty et al. (2015) have revealed that the brain’s default mode network, associated with creativity and idea generation, operates by flexibly connecting disparate neural networks rather than being confined within a fixed mental “box.”
Counterexamples from Technology and Innovation:
The realm of technological advancements offers further evidence against the necessity of a mental “box” for innovation. Breakthrough inventions such as the Internet, artificial intelligence, and quantum computing were not conceived within existing conceptual frameworks but emerged as transformative ideas that challenged conventional limits. These examples underscore the ability of human thought to transcend established boundaries and generate revolutionary concepts without being constrained by a predefined cognitive framework.
Conclusion:
While Thomas C. Südhof’s statement regarding the need for a mental “box” to think outside of it is thought-provoking, it does not withstand scrutiny when considering the broader scope of human creativity and problem-solving. The existence of innovative breakthroughs across scientific, artistic, and technological domains highlights the capacity of human thought to transcend preconceived boundaries and generate novel ideas. While conceptual frameworks can provide structure and context, they are not fundamental prerequisites for original thinking. By embracing the limitless potential of the human mind, we can foster a culture of unrestricted creativity and promote paradigm-shifting discoveries.
References:
Beaty, R. E., Benedek, M., Kaufman, S. B., & Silvia, P. J. (2015). Default and executive network coupling supports creative idea production. Scientific Reports, 5, 10964. doi: 10.1038/srep10964
Guilford, J. P. (1950). Creativity. American Psychologist, 5(9), 444-454. doi: 10.1037/h0063487
LikeLike
I’m sorry. Couldn’t resist.
The Role of Courage and Persistence in Scientific Discovery: A Rebuttal to Lu Chen’s Claim
‘Scientific discoveries are never made with fear of being wrong, but with courage and persistence of approaching truth with trial and error.’
Abstract:
This paper presents a rebuttal to the claim made by Lu Chen that scientific discoveries are never made with fear of being wrong, but with courage and persistence of approaching truth with trial and error. While it is acknowledged that courage and persistence are important qualities in scientific inquiry, this rebuttal argues that the fear of being wrong can also be a driving force in scientific discovery. By examining historical and contemporary examples from the scientific community, we demonstrate that fear of error, combined with courage and persistence, has played a crucial role in advancing scientific knowledge.
Introduction:
Lu Chen proposes that fear of being wrong is not a driving factor in scientific discoveries, but rather courage and persistence are the key attributes that lead to successful scientific exploration. While it is true that courage and persistence are essential characteristics, this rebuttal argues that the fear of being wrong should not be dismissed as a motivator for scientific progress. By examining the scientific method, historical examples of scientific breakthroughs, and contemporary research practices, we demonstrate that the fear of error can be a powerful catalyst for scientific discovery.
Fear of Being Wrong as a Catalyst for Scientific Discovery:
The scientific method itself is founded on a skeptical approach, where hypotheses are formulated and tested rigorously. Scientists strive to disprove their own theories and predictions through experimentation and observation. This process inherently involves the fear of being wrong, as scientists seek to falsify their own hypotheses to ensure the validity of their conclusions.
Historical Examples:
Throughout history, numerous scientific breakthroughs have been driven, in part, by the fear of being wrong. One notable example is the case of Albert Einstein and his theory of general relativity. Einstein initially faced skepticism and doubt from the scientific community, but his fear of potential errors led him to devise and conduct rigorous experiments to test his theory. Ultimately, his courage to challenge established beliefs, combined with the fear of being wrong, led to the confirmation of his theory and revolutionized our understanding of gravity.
Contemporary Research Practices:
In modern scientific research, the fear of being wrong is evident in the rigorous peer-review process. Researchers are aware that their work will be scrutinized by experts in the field, and the possibility of errors or flaws being exposed instills a sense of fear and motivates scientists to ensure the highest quality of their work. This fear drives them to conduct extensive experiments, gather robust data, and critically analyze their findings, ultimately leading to more reliable and accurate scientific discoveries.
Conclusion:
In conclusion, while courage and persistence are undeniably crucial attributes in scientific discovery, the claim put forth by Lu Chen that fear of being wrong plays no role in scientific progress is untenable. The fear of error is deeply ingrained in the scientific method and has served as a catalyst for numerous scientific breakthroughs throughout history. Moreover, in contemporary research practices, the fear of being wrong drives scientists to uphold rigorous standards, leading to more accurate and reliable scientific discoveries. Therefore, it is essential to recognize the role of the fear of being wrong, in conjunction with courage and persistence, in advancing scientific knowledge.
References:
Einstein, A. (1915). Die Feldgleichungen der Gravitation [The field equations of gravitation]. Sitzungsberichte der Königlich Preussischen Akademie der Wissenschaften zu Berlin, 844-847.
Kuhn, T. S. (1962). The Structure of Scientific Revolutions. University of Chicago Press.
Popper, K. R. (1959). The Logic of Scientific Discovery. Routledge.
Smith, C. R., & Rennie, D. (1996). The tasks of peer reviewers: a statement by the
LikeLike
In a better world, these would be two important contributions to Science and Nature.
LikeLike
“Yup we are being hounded….
… My people didn’t check the excel files for repetitions before they submitted them, nor did I – which was a grave oversight. ”
Wut? Complaining about being called out for, at a minimum, a “grave oversight”?
LikeLike
“if fear of making mistakes prevails and paralyses creativity and daring attempts to make discoveries, where do you think the future of science will be?”
This is extremely unlikely, and Lu Chen knows it. Trying to guilt trip the accuser. It’s more like this in a “high profile” academic lab:
“if fear of not having exciting results to get published in Science, Nature, or Cell to get a steady job/$$$ and become a person respected by his peers causes irreproducible and worthless data, where do you think the future of science will be?”
There is a lot of fear in these “high profile” labs, and a lot of irreproducible crap being generated by hacks in these labs being “advised” (lol) by their lazy, rationalizing PI’s. The honest people are slowly but surely being weeded out. That now is the future direction of science.
LikeLiked by 1 person
Even outside of academic labs…
Just recently my division head told me (because he didn’t like me telling him the deadline he set is unachievable due to missing testing): ‘You don’t have to test it, just document that you did.’. This is R&D of medical devices/software… So I did what I had to and moved up to the top of his list of people he wants to get rid of.
LikeLike
Yep, the fear of making mistakes is nothing in comparison to the fear of being out of a job or a grant.
LikeLike
Copy-paste errors are very frequent in the two labs of Chen and Südhof. Send the students to an advanced CTRL+C/CTRL+V course in another lab! There are several groups masterfully handling this technique right there at Stanford!
LikeLike
Chen: “Science is what I do for life, not a means to power or wealth.” Great. However, what is approximatly Chen’s salary there at Stanford, if I may dare?
LikeLiked by 1 person
“I look at all the original data (which unfortunately are not the excel files in the incriminated papers….”
I wonder what Sundhof means by original data? Does he really mean he looks at only the final figure? Why isn’t he looking at excell data files, like he should be? His most important job is to see to it the reproducibility of research, which he apparently is failing to do to some degree.
Out of the six academic labs I worked at, 1/2 of the PI’s would only look at data if it was in the form of a final figure, and one got angry if it was presented in any other way, like the same data in an excell-prepared graph. It almost seemed like it was beneath the PI’s to look at an excell-prepared figure, much less actual numbers in an excel file.
The last lab I worked at has data in final figure graphs, but with absolutely no description or annotation anywhere what the graph was about so that others who joined the lab later could correctly interpret it….not even a legend for the future figure. Just scatter plots, error bars, and best fit lines. In that lab, I was lucky to see a graph with an axis so clearly labeled that it would not be misinterpreted by someone who did not do the experiment. Interestingly, the guy “running” the lab (an MD with a lot of clinical responsibilities but I guess who “wanted it all” by having a lab support his career ambitions) suggested in a lab meeting he wanted to get attention of swedish scientists for a run at the nobel prize. Nobel prize aspirations with incompetent data keeping, I’m guessing this is average these days at high profile labs, like Sundhof and Sabatini
LikeLike
Another Nobel Prize winner with dodgy data,
Robert J Lefkowitz, Duke.
https://www.nobelprize.org/prizes/chemistry/2012/lefkowitz/facts/
Problematic data, including a retraction.
Other retractions to come?
https://pubpeer.com/search?q=Robert+Lefkowitz
http://retractiondatabase.org/RetractionSearch.aspx#?auth%3dLefkowitz
LikeLike
We can thank the University of Glasgow for Robert J Lefkowitz’ retraction.
Neither Duke (history of scamming the public purse), not Stanford have the scientific integrity that the University of Glasgow has. Hats off to the University of Glasgow, a beacon of light!
LikeLike
Duke scamming the public purse
LikeLike
Thomas C. Südhof can build a coalition of Nobel Prize winners who have dodgy data:-
Louis Igarro Nobel Prize, Physiology or Medicine 1998,
Gregg Semenza m, Nobel Prize, Physiology or Medicine, 2019, and,
Robert J Lefkowitz, Nobel Prize Chemistry, 2012.
That should put a stop to any data correction, or retractions, because people need their votes to get Nobel Prize.
LikeLike
You forgot Sir Martin Evans and his Celixir.
LikeLike
Look up those names on Pubpeer.
Louis Ignarro, Gregg Semenza (7 retractions), Robert Lefkowitz (1 retraction).
There are problematic data.
I don’t know if Novel Prize winners have more problematic data than non-Nobel winners, but those three Nobel Prize winners do have problematic data.
My point was that those three Nobel Prize winners do have problematic data.
The dataset is in complete, but that is not a reason not to pint our the problematic data.
LikeLike
I dislike the connection made between winning a Nobel prize and running a lab generating dodgy data. I did not do the statistics, but would bet a correlation is absent. Probably even before correcting for the extra attention these labs receive or the number of papers they produce.. A far better predictor would be the country in which a lab is located.
And yes, there are definitely Nobel price winners that went ‘overboard’: https://en.wikipedia.org/wiki/Nobel_disease. Given the interesting numbers of (COVID/election/…) conspirationist this seems to be human, maybe aggravated by extra attention.
To me this post is mainly about a lab that has not YET dealt well with a case that I belief is serious and was already raised March this year. And about a second, in many ways connected lab that seems to go a similar route, noting that here the case is only some 2 weeks old. I hope the realization now sets in that something is amiss and that more scrutiny than simply full trust is required. And likely a bit more automation to aid the record keeping.
Maybe I will become bitter when after a few months the latest data ends up in a correction of the Neurexin-2 paper. Or when the Retinoic acid paper keeps it’s impossible data. But not now. And definitely not by referring to issues in other Nobelist’s labs.
LikeLike
Well, Nobel and other elite labs have one important thing in common. An absent PI.
Fraud also happened in Frances Arnold’s lab. She retracted that paper. Look how the men behave though.
LikeLike
Laureate Linda Buck also retracted fraudulent papers in Science, Nature, and Pnas:
https://www.nature.com/articles/news.2010.489
LikeLike
There were THREE retractions as you say, Nature, Science , and PNAS. In all three cases, Nobel laureate and neuroscientist Linda Buck determined that the results were not reproducible. In two most recent retractions, the first author Zhihua Zou did not agree to them.
https://www.nature.com/articles/nature06819
https://www.pnas.org/doi/10.1073/pnas.1000897107
https://www.science.org/doi/10.1126/science.329.5999.1598-a
NYT hints that Zou was sacked after fraud findings.
“After the Nature retraction in 2008, Dr. Buck and her colleagues revisited other papers based on Dr. Zou’s experiments. “They were unable to reproduce key findings in both papers,” a statement from the cancer center said.
In addition, figures published in the 2006 article were inconsistent with the original data, the statement said.”
But Südhof doesn’t need to check if his results are reproducible. He is a man.
LikeLike
Wow. Linda Buck got seriously hammered. Probably still gets grants, though.
Sudhof/Chem will likely survive this unscathed. However, they should learn from the mistakes of others: don’t pull a Croce and sue, or you might lose your fine art collection.
LikeLike
The point was that the 3 Nobel Prize winners Louis Ignarro, Gregg Semenza and Robert Lefkowitz have problematic data.
I don’t know what correlation to what other characteristic there needs to be to point out the problematic data. I don’t know how it correlates with the phases of the moon.
LikeLike
Andrew Schally (Nobel Prize in Physiology or Medicine, 1977): Andrew Schally had a paper retracted in 2006 from the Journal of Medicinal Chemistry due to concerns about the accuracy of the reported results.
David Baltimore (Nobel Prize in Physiology or Medicine, 1975): In 1986, a paper co-authored by David Baltimore, along with Thereza Imanishi-Kari and others, was retracted due to concerns about the accuracy of the experimental results. This incident, known as the Baltimore Affair, led to a controversy and subsequent investigations.
Luc Montagnier (Nobel Prize in Physiology or Medicine, 2008): Luc Montagnier, along with his team, published a controversial paper in 2011 suggesting the detection of electromagnetic signals from bacterial DNA sequences in water. This work has faced criticism and skepticism from the scientific community, but it has not been formally retracted.
Yoshinori Ohsumi (Nobel Prize in Physiology or Medicine, 2016): Yoshinori Ohsumi’s research on autophagy, the process of cellular recycling, has been influential. However, there have been instances where some of his papers faced concerns related to image duplication and other issues. These concerns did not result in retractions but led to corrections and clarifications.
Bengt I. Samuelsson (Nobel Prize in Physiology or Medicine, 1982): Co-authored a paper that was retracted in 1998 due to concerns about the reliability of the data.
Shinya Yamanaka (Nobel Prize in Physiology or Medicine, 2012): Yamanaka co-authored a paper in 2004 that was retracted in 2005 due to concerns about the reliability of the reported results. The retraction was attributed to an error in the experiments.
LikeLike
Baltimore and his lady friend Imanishi-Kari never retracted anything. They deployed lawyers and won in full. The whistleblower Margot O’Toole was publicly humiliated, slandered, and drummed out of science.
Here is that fraudulent Cell paper, perfectly fine and 100% trustworthy.
https://doi.org/10.1016/0092-8674(86)90389-2
PS: Daniel Kelves is a prick.
LikeLike
My bad, Weaver et al 1986 was retracted in 1991. Cell is just hiding the retraction, even behind a paywall.
https://www.cell.com/cell/fulltext/0092-8674(91)90085-D
https://sci-hub.se/10.1016/0092-8674(91)90085-D
LikeLike
Hm… retracted paper co-authored by David Baltimore, Thereza Imanishi-Kari… titled “Antigenic competition in the primary response to DNA,” was published in the journal Cell in 1986.
Can you check this? Did this exist?
LikeLike
You are right, cell hid the retraction. Baltimore had two more, see another comment here.
LikeLike
“a correlation is absent” is probably not the right wording. I very much doubt that those labs would do worse than their peers.
LikeLike
I think a correlations is likely there because its easy to think of a mechanism by which it exists: in a big shot lab (run by a famous person, think nobel prize winner, HHMI investigator, NAS member in the US), you know (as a post-doc) that all you need to do is get one paper in CNS (cell/nature/science) to get a decent job, so the temptation to fabricate for post-docs here is much stronger than in labs not run by famous people, as you know if you are in a lab not run by a famous person it may not make much of a difference in your future if you get a CNS paper, except maybe a “better” postdoc. A good example of this (albeit without control) is post-doc Janine Erler in Amato Giaccia’s lab at Stanford, or the several busted postdocs working for Carlo Croce in Ohio State.
I call this the Croce effect.
LikeLike
“post-doc Janine Erler in Amato Giaccia’s lab at Stanford”
I would only credit Janine Erler with a small proportion of Amato J Giaccia’s problematic data.
https://pubpeer.com/search?q=Giaccia
Btw, Giaccia is now at Oxford. Tally ho!
https://www.oncology.ox.ac.uk/team/amato-giaccia
LikeLike
I call this the Karin effect
LikeLike
https://www.nobelprize.org/prizes/medicine/1975/baltimore/facts/
http://retractiondatabase.org/RetractionSearch.aspx#?auth%3dBaltimore%252c%2bDavid
3 retractions, 2 as senior author.
LikeLike
https://www.nobelprize.org/prizes/medicine/1993/sharp/facts/
https://pubpeer.com/search?q=Phillip+A+sharp
LikeLike
First author on both 2009 retractions by Baltimore (here and here) is his former postdoc Luk Van Parijs.
https://www.nature.com/articles/474552a
NOW THE BEST PART:
https://www.foxnews.com/story/suspect-scientists-papers-being-reviewed
LikeLike
Not uncommon for Nobel laureates to retract papers (regardless of the reason). Others include Bruce Beutler :
and Jack Szostak:
LikeLike
Speaking of Bruce Beutler: his Nobel co-recipient Jules Hoffman was accused by his former postdoc Bruno Lemaitre to have unjustly grabbed the Nobel for his own discovery:
https://www.science.org/content/article/nobel-prize-immunologists-provokes-yet-another-debate
Lemaitre’s own blog on this topic: http://www.behinddiscoveries.com/
Disclaimer: In 2015-2016 I worked for Lemaitre editing his book and article about narcissism (for very little money), he then invited me to his lab to give a talk, and broke off contact right after. Guess he didn’t need my services anymore.
LikeLike
Is there an experimentalist who can enlighten me? I have done quite some electrical measurements on multiple (nonbiological) systems and I am a bit puzzled by the spike data. There is a spike graph above that shows current noise levels << 1 pA with a time resolution of around 1 ms. This does not quite require electron counting but is not so far from it… I have build systems with 10 fA noise levels but never with such a high bandwidth. Does someone know how this is measured? Is this standard?
LikeLike
I did not look into the details of the equipment that was used. But the very low noise at ms-level time resolution figure is an average of many pulses. When the authors show raw time traces (e.g. https://iiif.elifesciences.org/lax:79863%2Felife-79863-fig1-v2.tif/full/1500,/0/default.jpg, no vertical scale but the average spike amplitude should be ~10 pA) I see pA-level noise.
LikeLike
I think what we are witnessing at Stanford, Weill-Cornell, Duke, Johns Hopkins, MD Anderson, and on down….what may be called….the banality of fraud (in science). It really doesn’t seem to be a big deal to these institutions. PI’s running the lab where its happening either wont acknowledge it or do a lot of hand waving to divert attention from it. Without outside intervention, it will surely continue, if not multiply.
LikeLike
Fine Nobel Prize winner does have problematic data.
https://www.nobelprize.org/prizes/medicine/2012/gurdon/facts/
https://pubpeer.com/search?q=Gurdon
LikeLike
Pingback: Thomas Südhof and the standards of scientific rigor – For Better Science
Pingback: Nobel laureate’s study earns expression of concern over data integrity issues | Spectrum | Autism Research News
A correction for Sudhof’s eLife paper issues was published in October.
https://www.ncbi.nlm.nih.gov/pmc/articles/PMC10635641/
Considering the manipulations/fabrication of excel data sources in his papers, I believe the raw data should be published too to earn the readers trust on his corrections.
LikeLike