
Maarten van Kampen was so impressed with the story of the one-man papermill Ahmed Shalan that he can’t let go of it. The Dutch sleuth just can’t understand why nobody cares about the massive fraud, not in Spain where Shalan works now, not in Japan where he graduated with PhD, and certainly not in Shalan’s home country Egypt where he has his main academic affiliation.
But also in Egypt, an aspiring Shalan-esque one-man-papermill is rising. His apprentice Mohamed K Ahmed (MK Ahmed) recently started fabricating nanotech papers of his own with amazing efficiency. Maybe nanotechnology and materials science are supposed to be fake? In any case, a new star is born, and Maarten van Kampen investigates again!

Anatomy of a Retraction
From “analysis and conclusion of our paper remain valid” via drafted correction to “the authors retract this publication”. A guest post by Maarten van Kampen.
Egypt: lost civilizations
By Maarten van Kampen
Egypt is the land of ancient astronomy and mighty pyramids. It is also occasionally home to major research fraud*. This famous and fake Egyptian study on the use of Ivermectin against COVID featured that many participants that subsequent meta-analyses showed some efficacy of the drug. It killed people and fueled conspiracy theories around the world. And it continues to do so, even though it is retracted by the work of data sleuths. The country also produced a slew of fake randomized control trials. These also have a true life-and-death impact: the results in this recently retracted paper were used to decide on the treatment of unborn children.

In the physical sciences Egypt does equally well, but with less impact. Ahmed Shalan, of this site’s one man paper mill, started his publishing career in Egypt and is still affiliated with a Cairo-based research institute. This post is about a fellow material scientist: M.K. Ahmed. Ahmed’s path crossed several times with that of Shalan and the resulting papers are masterpieces of fraud. Ahmed boasts in his LinkedIn profile
‘More than 80 articles and H-index over 25 (Scopus) have been achieved‘.

Ahmed is indeed a busy researcher. In between his lecturing of the next generation of material scientists he manages to author more than 1 paper every two weeks:

His stellar rise in publishing started in 2020. The few papers before this creativity explosion are, however, also worth looking at. Take for example his first publication pair from 2005, with the differences between the abstracts labelled in yellow:

This already gives a taste of what is about to come: results can best be published in pairs!
From 2015 to 2017 Ahmed worked on his PhD at the Zagazig University in Egypt. Here he learned the tools of his later trade: take the bone-like material HAP, dope it with a letter soup of other elements (Mg, Ag, ZrO2, Pd, …) and report XRD, FTIR, SEM, TEM, cell viability (for good cells) and anti-microbial activity (for bad cells) of the soups you made. And then make some allusions to its usability for bone replacement, wound dressing, or, say, the removal of heavy metals from wastewater.
Apart from the above mundane work he also made a seminal discovery: one can turn SEM images into AFM images! And the trick to achieve this? Read this peer-reviewed excerpt:
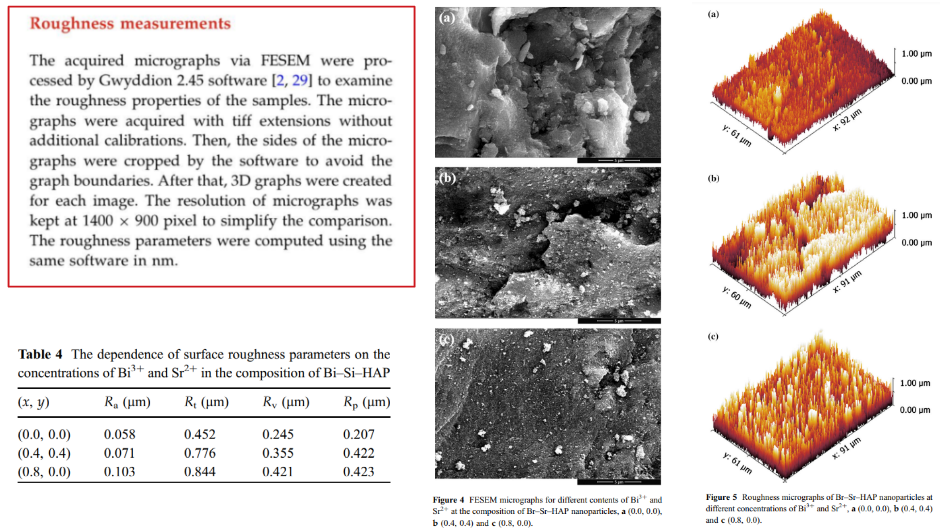

The procedure is detailed in the images above. First one crops the pesky annotations from the SEM image. Then one loads the SEM image into AFM processing software using the default import settings. The confused software will treat the grayscale values as heights in a 0-1 um range. It will do this with any image you feed it, so it is a completely general method! With a few more clicks one can then generate beautiful but utterly useless eye candy: 3D height representations of SEM grayscale data. And, as a bonus, one can report a litany of meaningless roughness values in scientific looking tables. The vertical scale will invariably be in the 0-1 um range as can be seen in the 80+ papers Ahmed published using this ‘technique’.
It must be tempting to take full credit for a discovery like this. Being modest, Ahmed does not only cite the seminal 2017 Scientific Reports paper with the discovery, but also a 2017 paper from unrelated authors. The only thing the latter authors did to deserve this honour was processing their AFM data using the same free-to-use AFM software. As a result, 14 of the 24 citations to their paper are by Ahmed…
The issue above is just peer-reviewed incompetence repeated 80+ times, not fraud. So let’s move on to fraud. Take a look at the XRD data below from five different Ahmed papers:
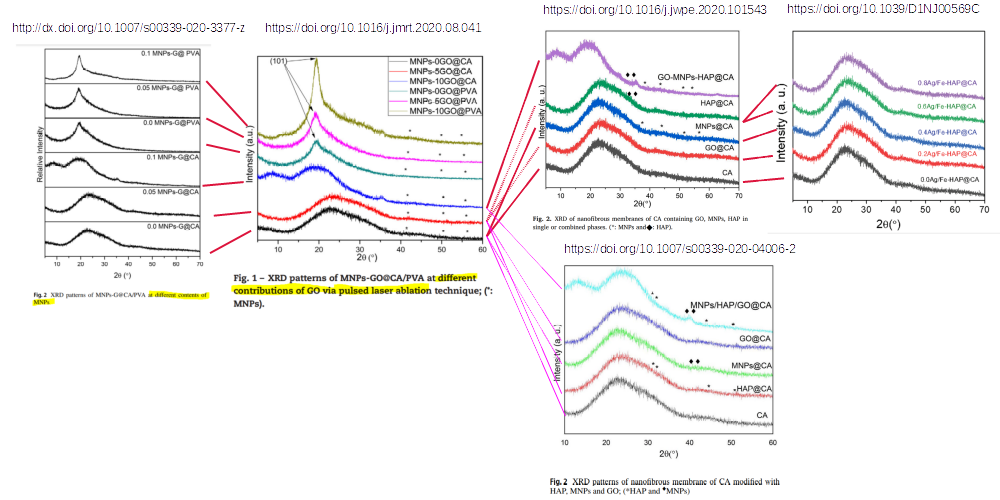
Due to what Dr Ahmed will surely explain as bookkeeping errors many curves are shared between the papers, as indicated by lines. In most figures they represent different compounds. Take for example the red curve. It stood for:
Such massive data ‘re-use’ feels Shalan-esque, and it is: the top-right figure hails from a paper that is first-authored by Shalan! In it you will find the compulsory SEM-derived ‘roughness’ plots, there brazenly described as AFM data, and also this “inadvertent” duplication spanning multiple papers:
Needless to say that the panels represent very different materials.
Shalan, who is also affiliated with the Basque Center on Materials, was ousted as a fraud last year. When BCMaterials boss Senentxu Lanceros-Méndez found Leonid metaphorically banging on his door in December he immediately announced an investigation. The warning must have sent the man scrambling to save his reputation as he is co-author on many Shalan papers. The most tangible results of the above investigation are the contract extension Shalan received April this year and a single correction of a PubPeer-flagged Shalan paper. That paper was incidentally co-authored by Lanceros-Méndez and… Ahmed!
The initially reported concerns for the Lanceros-Méndez-Shalan-Ahmed paper involved lots of ‘inadvertent duplications’: of the eight XRD measurements shown only four were unique. Also a figure with tensile strength measurements showed a duplicated curve, after vertical scaling that is:
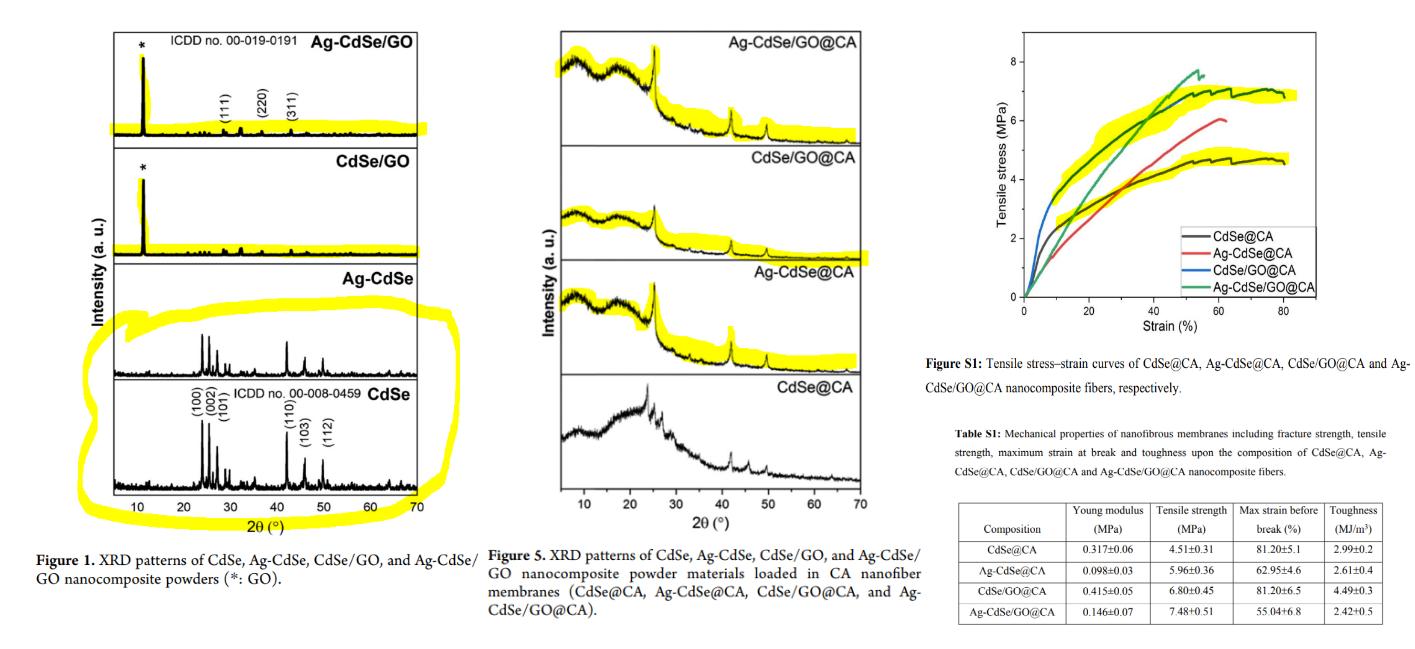
The authors dutifully went back to their raw data, presumably under close scrutiny of Lanceros-Méndez who must have been less than happy with this poisonous gift-authorship on a paper with otherwise Egyptian-affiliated authors. The correction followed on 18 May 2022, finding “editing duplication mistakes“:
In a fortuitous turn of events, the replacement tensile strength data for Fig. S1 showed exactly the same maximum strain and stress. This allowed for table S1 and all conclusions to remain unchanged!
“These corrections do not affect any discussion or conclusions of the work.”
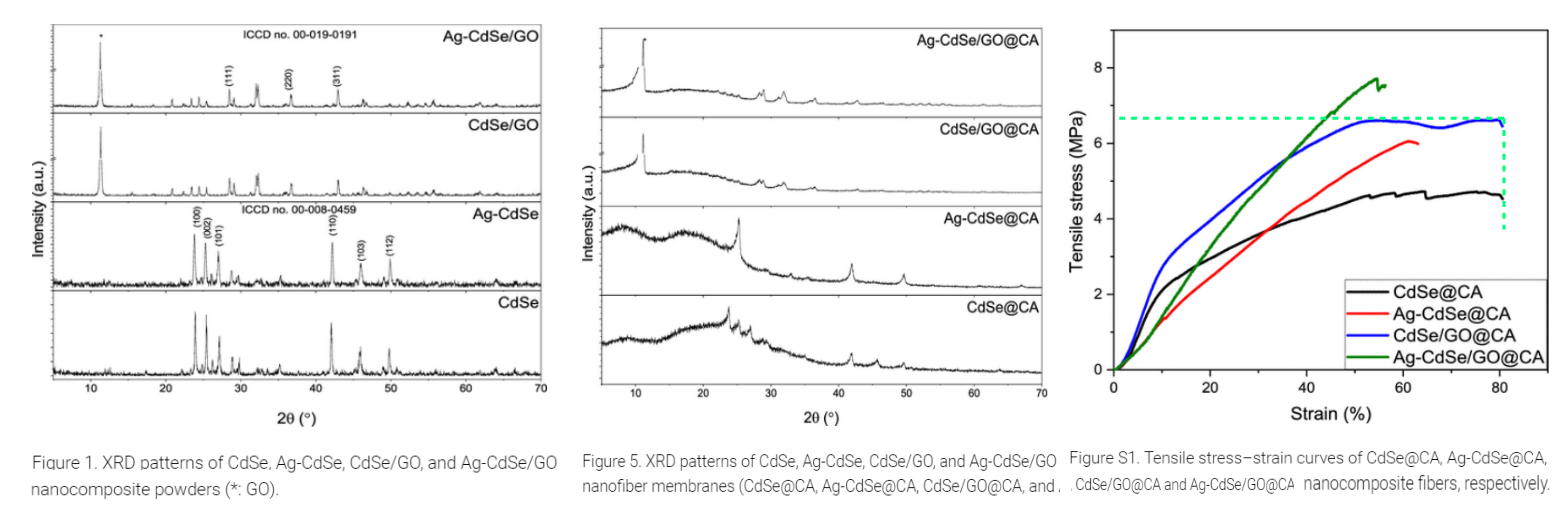
The above correction could have been the end of it, were it not not for the earlier mentioned habit of Ahmed to publish the same results twice: the corrected paper “Silver-Doped Cadmium Selenide/Graphene Oxide-Filled Cellulose Acetate Nanocomposites for Photocatalytic Degradation of Malachite Green toward Wastewater Treatment” (MG) has a twin in “Cellulose acetate nanofibers embedded with Ag nanoparticles/CdSe/graphene oxide composite for degradation of methylene blue” (MB).
After digesting the long titles it becomes clear that the materials are the same and that they are just used to mop up two different dyes: Malachite Green (MG) and Methylene Blue (MB). This can be checked by comparing the (just corrected) XRD data for the nanofibers in both papers:
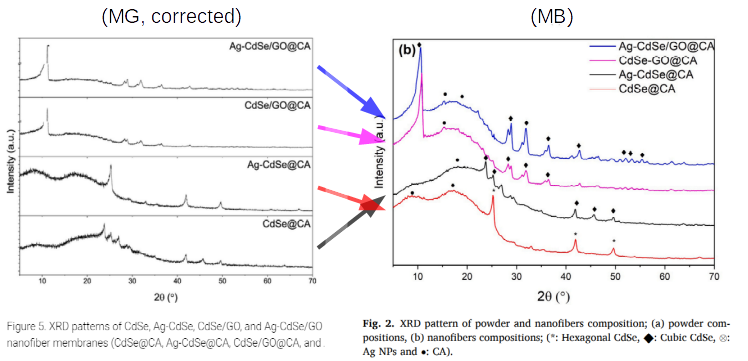
The spectra are identical, except that in a twist of irony the just-corrected Fig. 5 has a little mix-up in the curve labelling. The CdSe@CA and Ag-CdSe@CA curves of the MB paper appear swapped in the MG paper. And the MB paper must have it correct, as it specifically mentioned the ‘♦: Cubic CdSe’ peaks for the Ag-containing compound. Another correction for the Lanceros-Méndez-Shalan-Ahmed paper?
With the XRD data of the nanofibers identical, shouldn’t the tensile strength plots of these fibers also be identical? Let’s see:
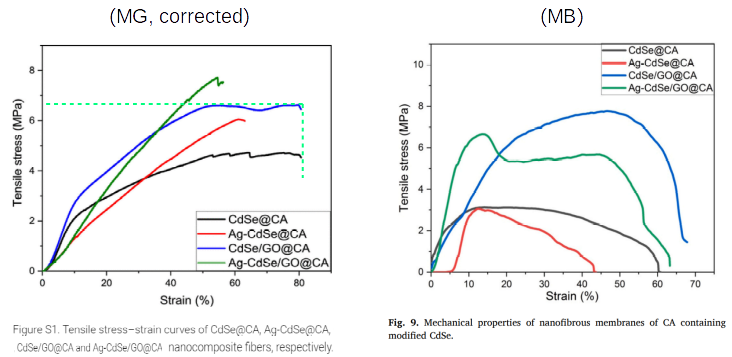
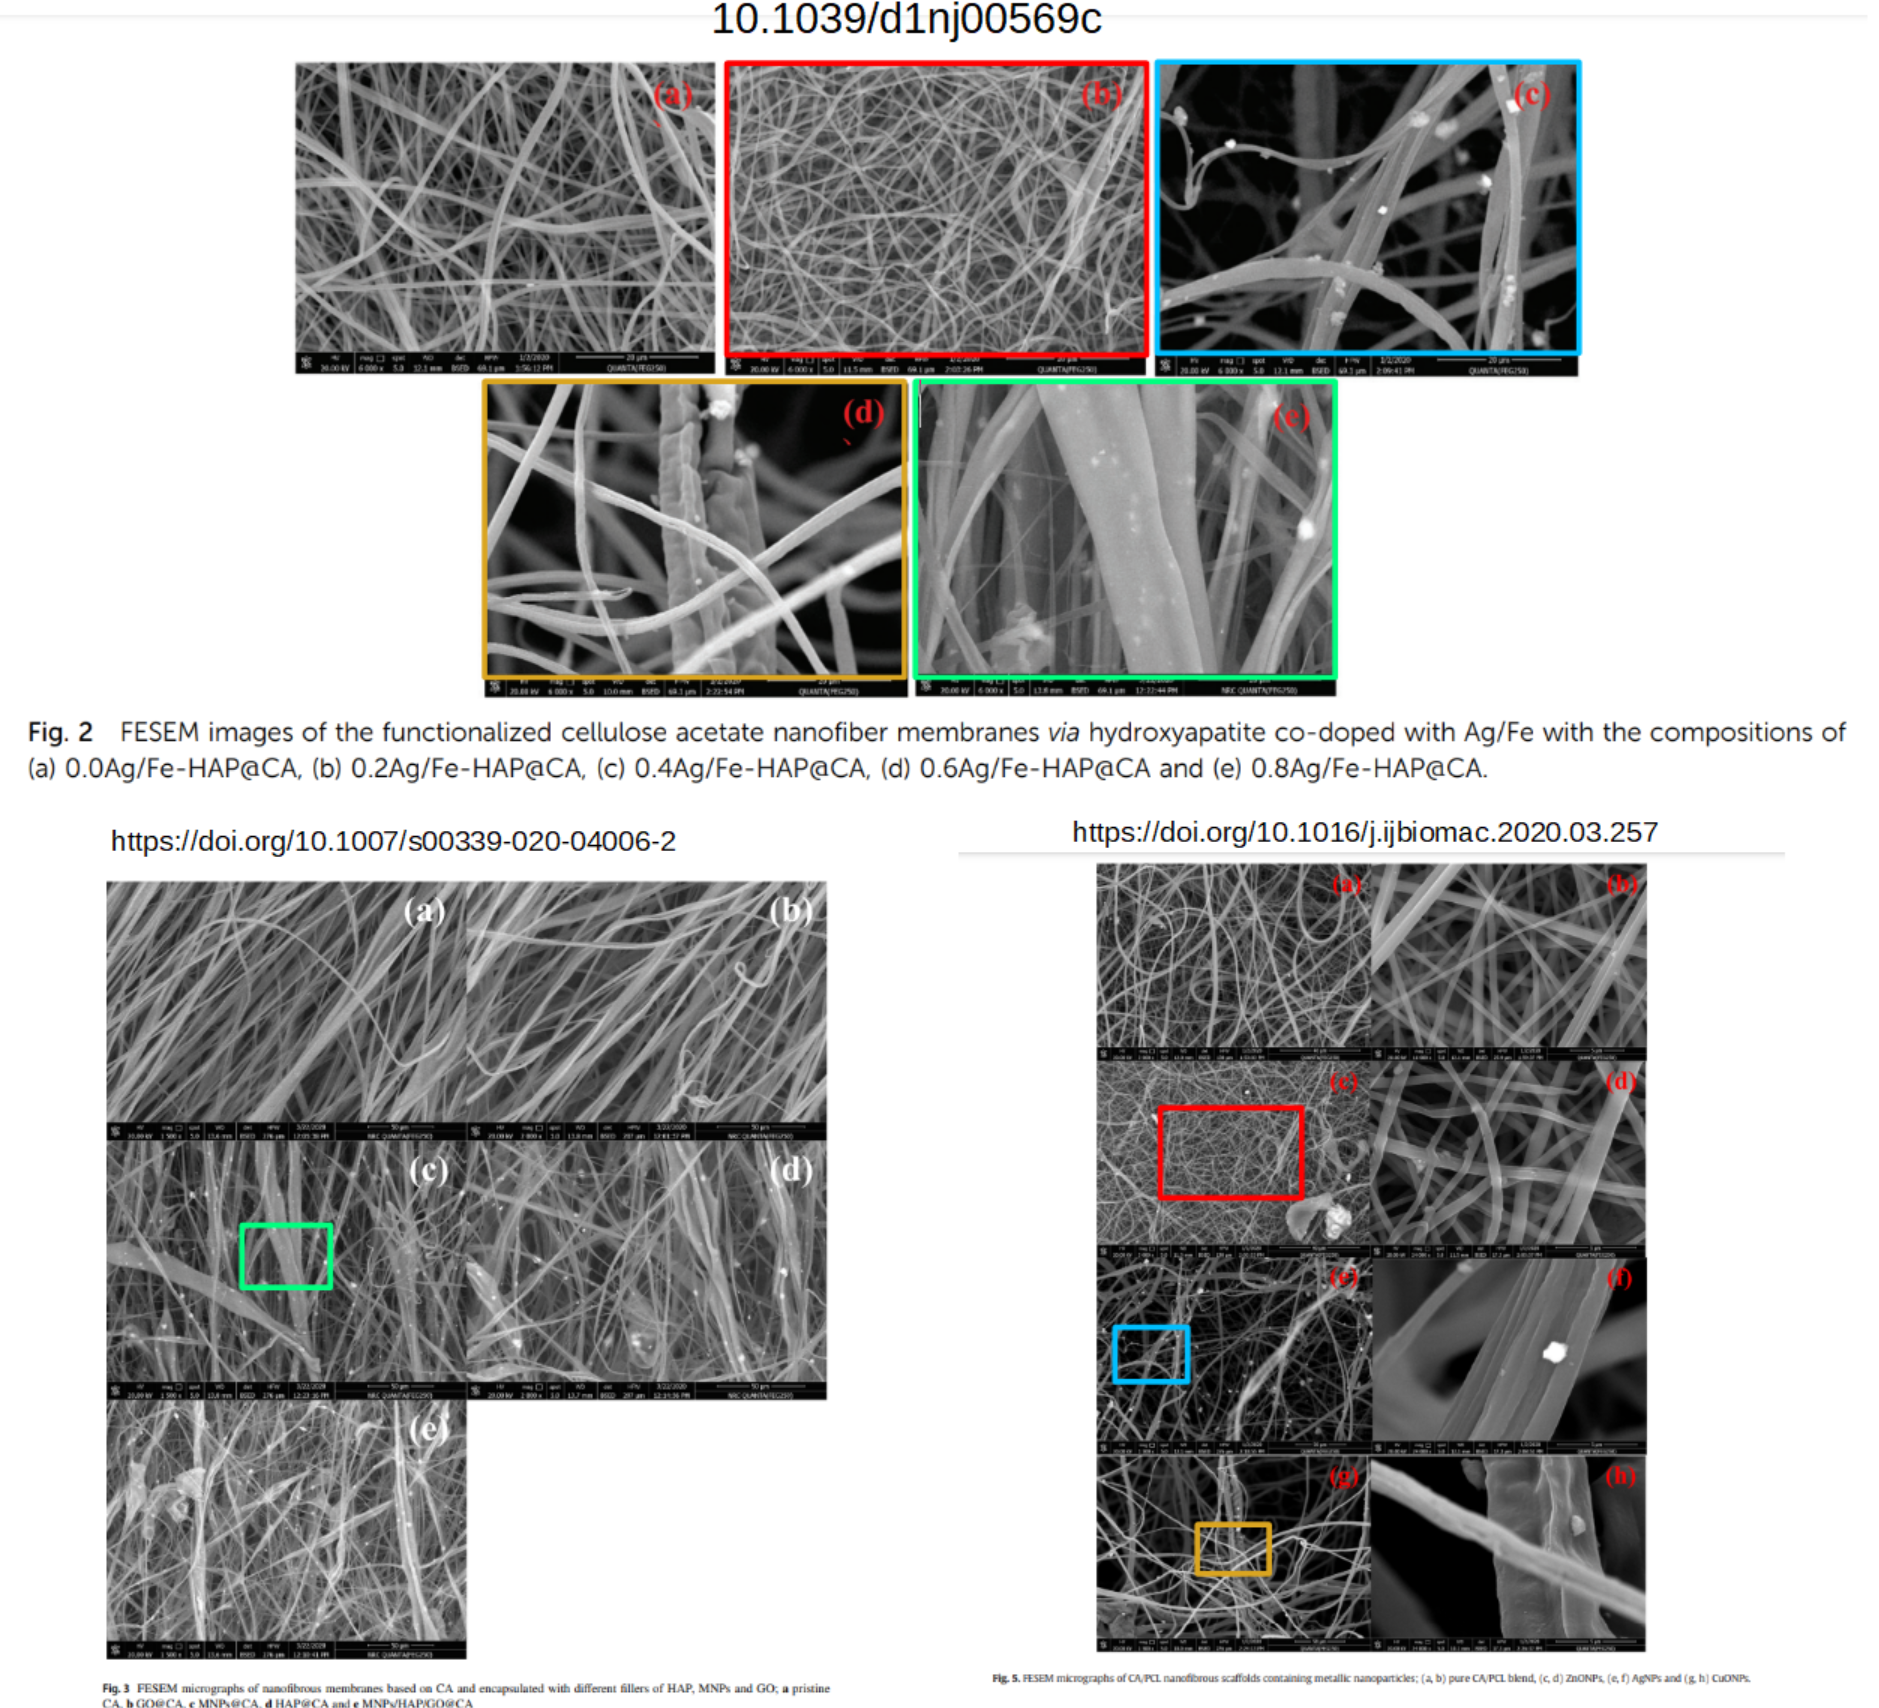
To ease comparison the authors use the same colour coding between the papers. And the measurement results are, well, shall we say unique and and not very reproducible? Fig. S1 may be in need of a retraction. The inconsistent tensile strength data between paper pairs is a bit of a hallmark of Ahmed, see e.g. here, here, and here. Looking at the SEM data in this paper pair more inconsistencies are visible:
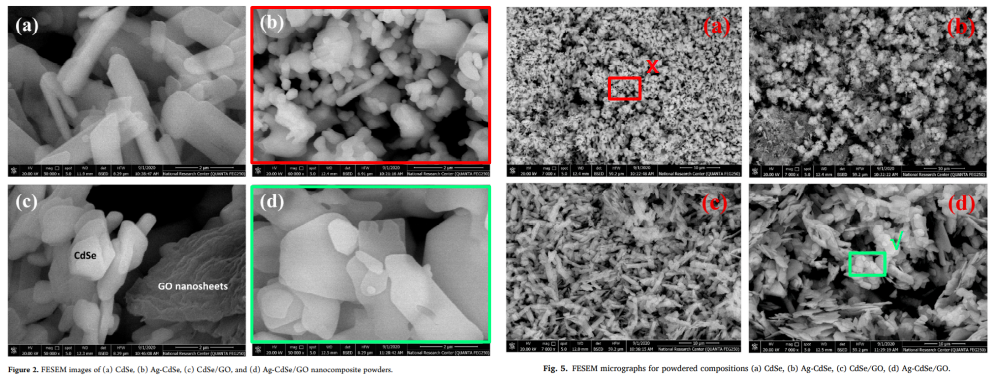
Since data re-use is frowned upon the authors add a veneer of authenticity by showing SEM images of the same samples at different magnifications. The overlap between panels (d) in green is possibly ok, as both represent Ag-CdSe/GO. But how did the Ag-CdSe in panel (b) in red become CdSe in the other paper?
Let’s make a bridge to another paper pair by examining the contact angle data in the MB paper, top-left below:

The droplet marked by the blue box makes a guest appearance in a different paper, bottom-left. There it is wetting a completely different alphabet soup: HAP/CdSe/GO@PLA. That paper is part of another paper pair featuring “Morphological features and mechanical properties of nanofibers scaffolds of polylactic acid modified with hydroxyapatite/CdSe for wound healing applications” (CdSe) and “Biological response, antibacterial properties of ZrO2/hydroxyapatite/graphene oxide encapsulated into nanofibrous scaffolds of polylactic acid for wound healing applications” (ZrO2). The contact angle data for the papers in this pair, shown in the bottom row, incidentally also share droplet photographs. To make the re-use complete: the unrelated paper in the top-right also shares yet another two photographs with those in our new paper pair.
The CdSe/ZrO2 pair shows a very strict template use, with figures and tables in a near-identical format and in the exact same order:

Do not forget to appreciate the compulsory 3D ‘height maps’ in the center of the figure. Every (really every) paper from his PhD time and on contains the golden flying carpets that purport to show sample roughness. The issues with this paper pair are run-of-the-mill: the material synthesis is subtly different, XRD data of (nominally) the same materials is identical, and most of everything else is different. Below the matching XRD data and hugely different tensile strength data:

Let’s make thing more interesting by looking at a genuine paper triplet:
- Mechanical, microstructural properties and cell adhesion of Sr/Se-hydroxyapatite/graphene/polycaprolactone nanofibers (G)
- Nanofibrous scaffolds of ε-polycaprolactone containing Sr/Sehydroxyapatite/ graphene oxide for tissue engineering applications (GO)
- Composition and design of nanofibrous scaffolds of Mg/Se- hydroxyapatite/graphene oxide @ ε-polycaprolactone for wound healing applications (Mg/Se)
The three papers study different materials. For the last Mg/Se paper this it is abundantly clear, for the G and GO papers it can be see their synthesis:
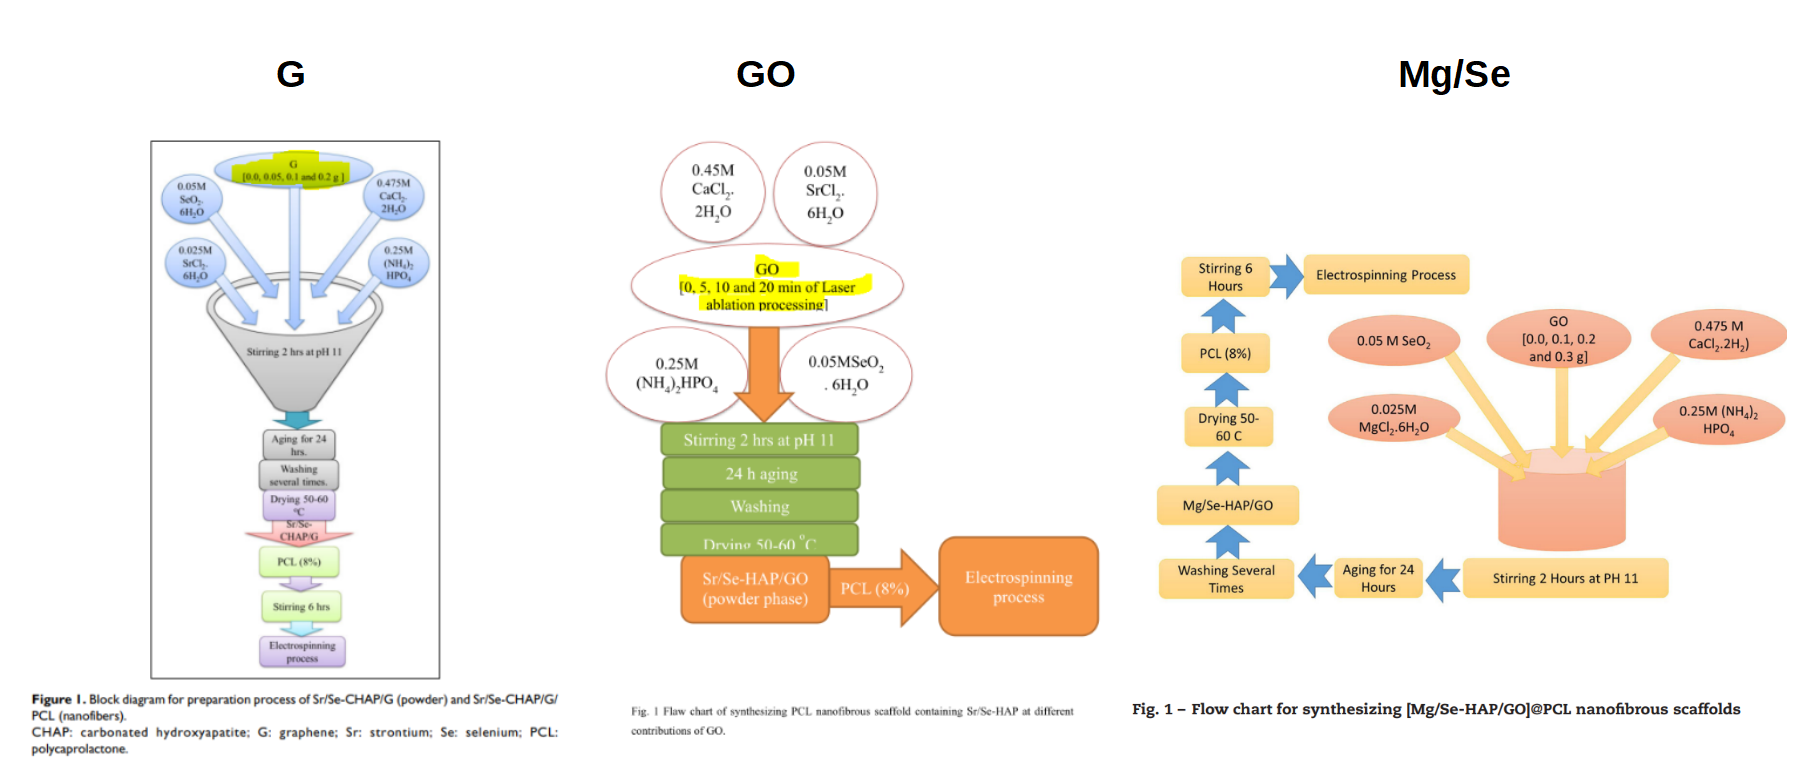
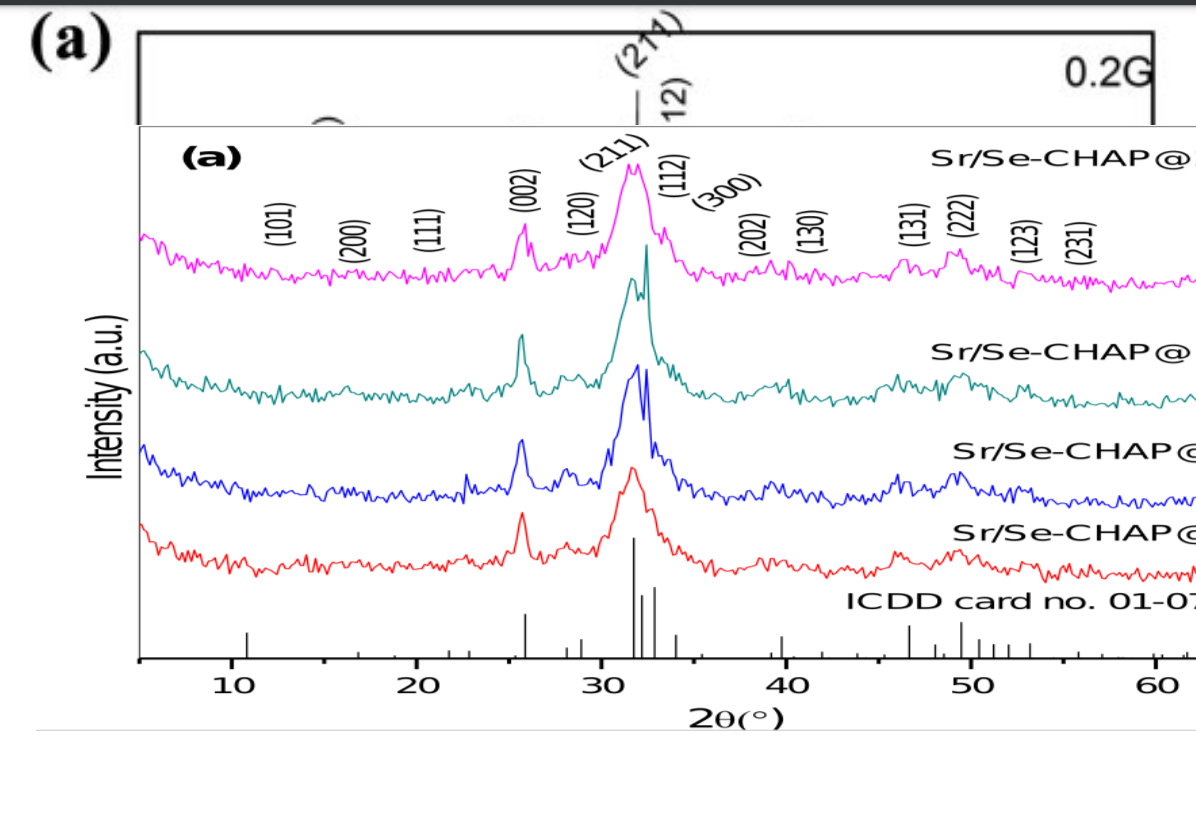
In the G paper the authors simply add an amount of graphene flakes to the mix during synthesis. The GO paper is more spectacular: the authors shoot with a laser at a piece of graphene oxide to dose GO. Because, why not. To make sure the synthesis is really different also the dosing of other materials is changed by up to a factor two. Here is the XRD data for the three papers:

The XRD curves of the materials are one-to-one identical, mapping the ‘0.xxG’ compounds from the G paper to ‘xxGO’ compounds from the GO paper. And then to some arbitrary Mg/Se mix… The pairing is somewhat obfuscated by smoothing in the GO paper. Except for the curve highlighted in yellow, where in an editing error the authors forgot to do this. Do not forget to look at the asterisks that pretend to indicate invisible HAP diffraction peaks. I like to see them as snowflakes randomly settling on the curves.
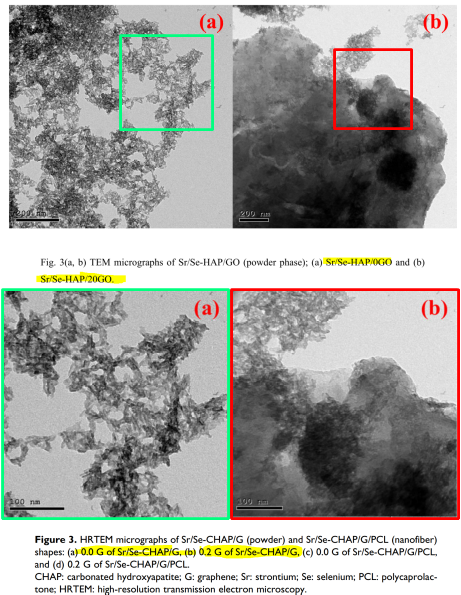
The TEM images in Figures 3 of the G and GO papers alleviate any doubt about XRD similarity by showing a solid overlap. After adjusting for the compulsory magnification differences, of course:
Thus far the authors managed to maintain a consistent ‘0.xxG -> xxGO’ material mapping. This pretense is completely dropped in the SEM imagery:
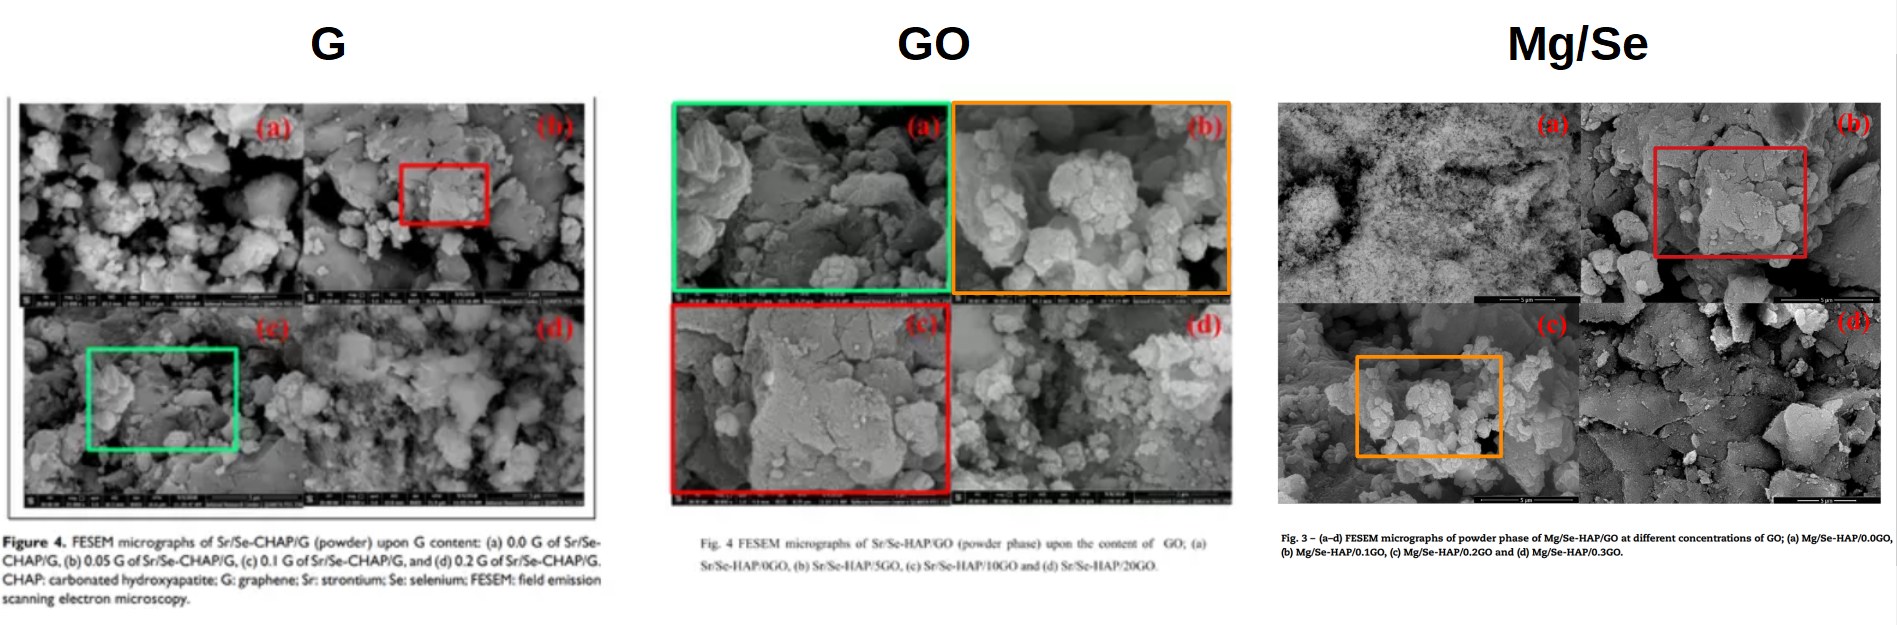

The authors stick to their M.O., varying magnification level between the papers. And, no surprise, there is plenty of overlap between the unrelated materials. Due to some “bookkeeping errors” the previously consistent mapping is broken and the authors just seem to have sprinkled the three papers with nice imagery. With some extra re-use in a fourth (Ag/V-HAP@PCL, bottom-right). Because, why not. The two SEM images indicated by a red question mark were taken less than 1.5 minutes apart on a different day than all other images. It stands to reason that they show the same material and thus have nothing to do with their neighboring panels. Which, according to the caption, should just show the same material at a different magnification.
The nanofibers that were shown to be identical in XRD and SEM were also subjected to tensile strength testing:
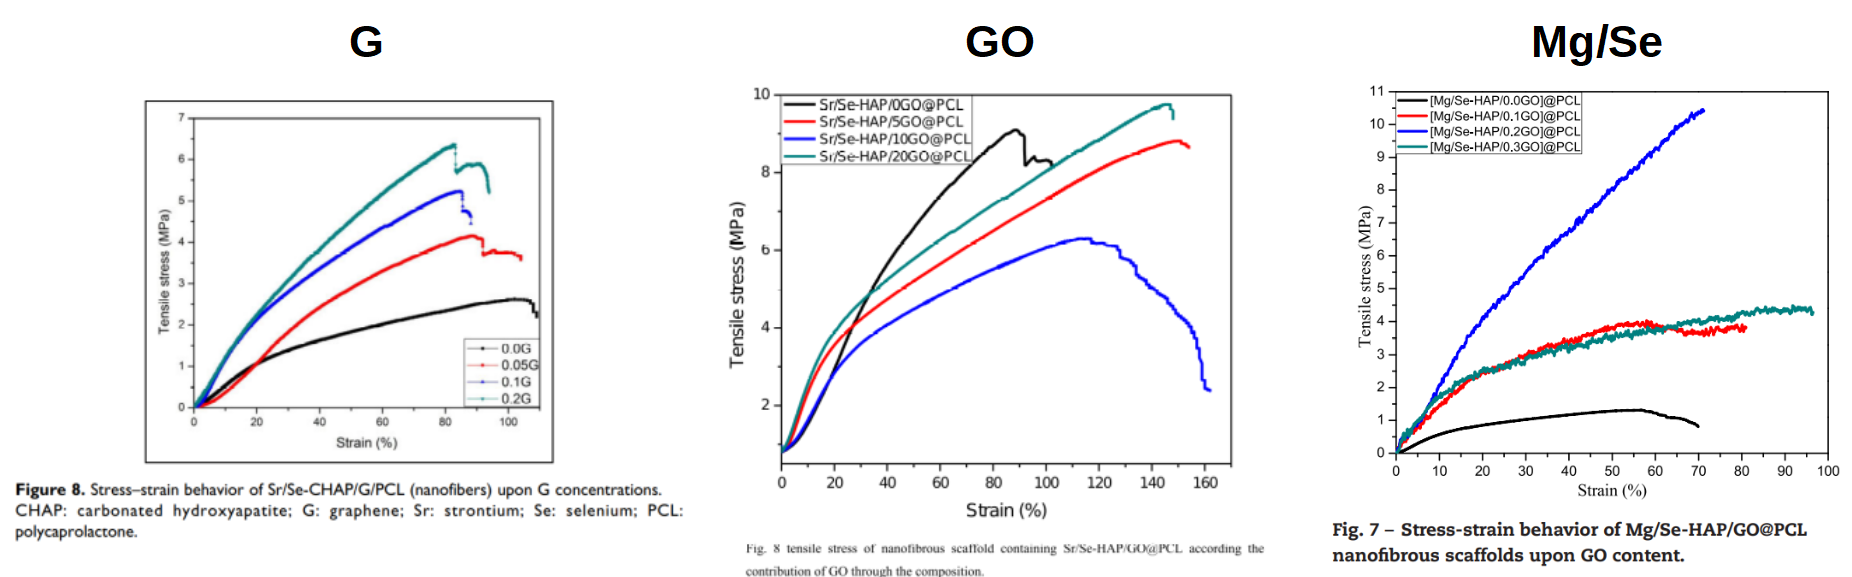
As noted before, the authors find it very hard to maintain consistency in their tensile strength data. The 20GO@PCL material is XRD, TEM, and SEM identical to the 0.2G@PCL fibers. Despite this, it can be stretched 1.5x further before it breaks (green curves)…
By now the point should be clear. M.K. Ahmed has 50- of his 80+ papers flagged on PubPeer for, well, mix-ups. Flagging the ‘SEM-derived roughness maps’ would lead to 80+ PubPeer entries. His entire research output appears to be a papermill-like fraud, using a template of “synthesis – analysis – results (kills bacteria/supports cells/soaks up heavy metals)”. And the supporting data is liberally shared between the many unrelated papers. The editorial wheels will be set in motion, expect a few retractions and an update in a year or two!

Yuqing Zhang’s 10 years of fraud, a whistleblower account
“All these SEM, EDX, TEM, BET, XRD, FT-IR, and contact angles in the theses and papers from our lab, where do they come from? We made them up. “
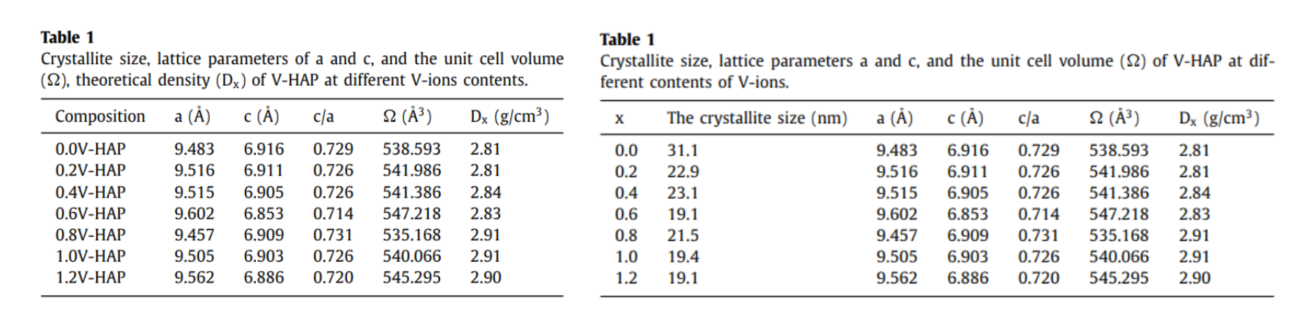
As a bonus, one final pair: “Physicochemical properties of hydroxyapatite modified with vanadium ions for degradation of methylene blue” (V-MB) and “Tuning the compositional configuration of hydroxyapatite modified with vanadium ions including thermal stability and antibacterial properties” (V-AB). The materials and their preparation are the same. The XRD curves in the figures 1 are not the same, but surprisingly the XRD quantification in the tables 1 is identical:

In figures 2 the authors present FTIR data. To prevent obvious duplication For clarity one paper reports absorbance, the other transmittance:
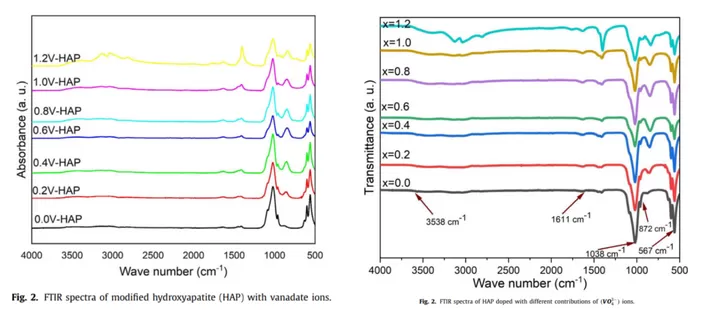

The data are identical. Let’s also look at the SEM data as thus far we just have boring double publishing:
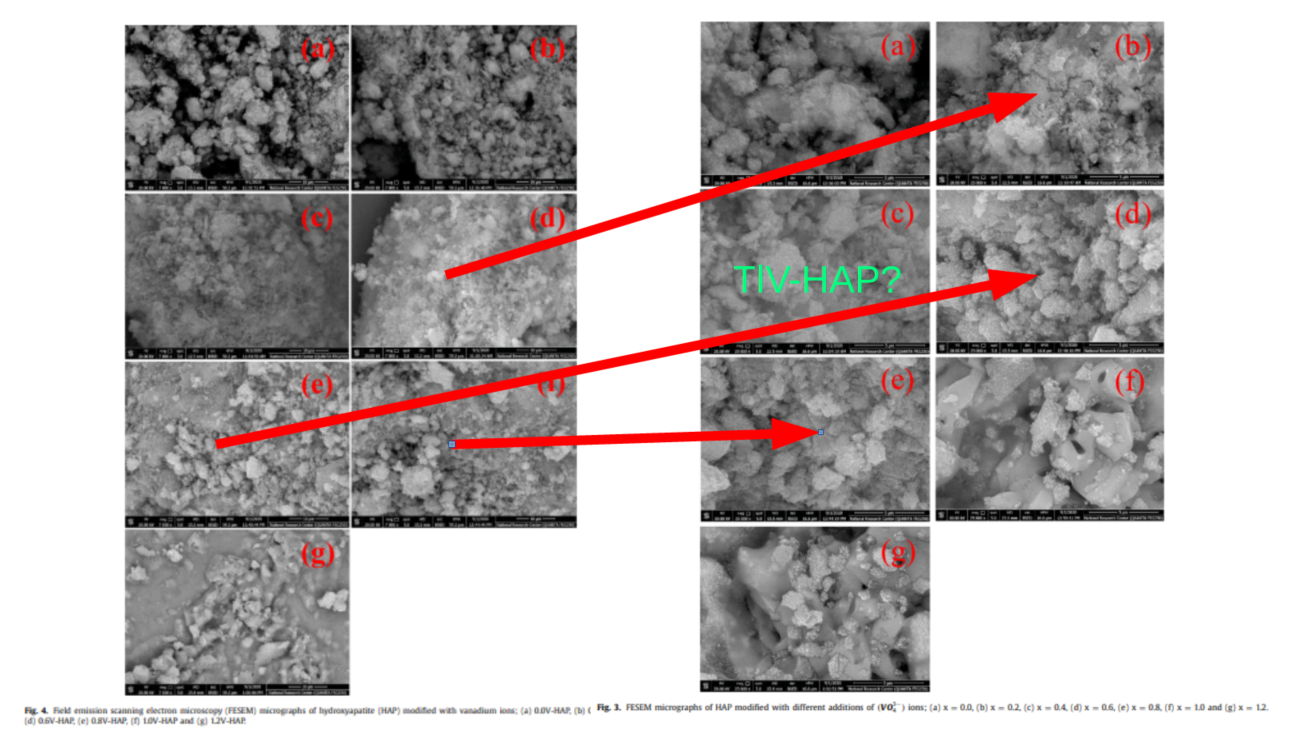

The panels should be pair-wise identical. Instead, it seems that the authors have simply sprinkled their papers with nice looking imagery. Panel (e) with the label ‘TV-HAP?’ is extra special, as it also features in ‘Thallium/vanadate co-substitutions…‘, representing 0.8Tl/V-HAP instead of 0.4V-HAP.
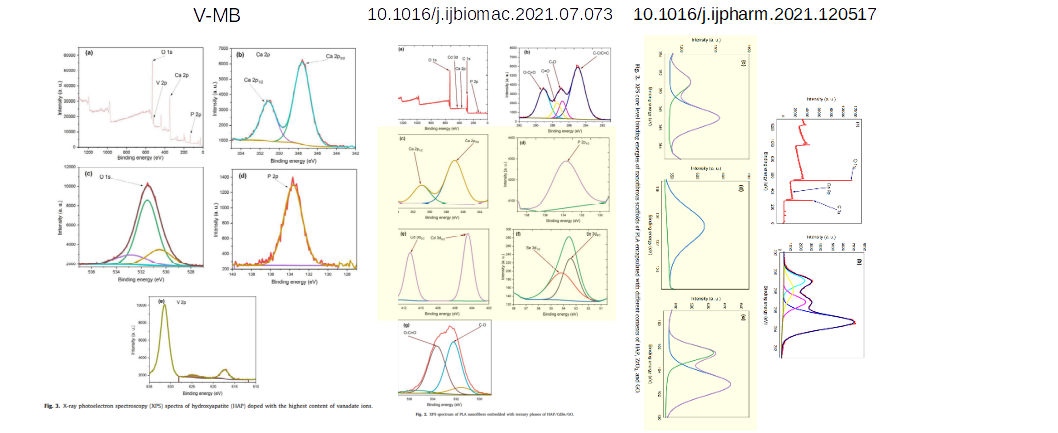
Besides the above negativeness there is also something good to be said about the V-MB paper: the figure showing XPS data actually shows fits and data. In many other papers the actual data is mostly missing, with fits shown instead:
* This can be said of many countries. China also sports ancient astronomy and research fraud on an astronomical scale. Spain can boast some 10th century astronomy due to it being conquered by the Arabs. And it has a rich history in both scientific fraud and subsequently covering it up. Both countries lack the pyramids, though.
[MK Ahmed did not reply to my email when invited to comment on his PubPeer record. -LS]


He is working hard, and now sending us invitation to publish chapter for his new book. Like minded researcher.
Dear Colleagues
We hope you are in good health and doing well.
I would like to let you know that we (Assoc. Prof. Ahmed Mourtada Elseman, Dr. Ahmed Esmail Shalan, and Prof. Mohamed Mohamed Rashad), have decided to bring out a book on a specialized topic “Perovskites Materials: Future, Challenges and Applications” under the publishing head of Springer Nature, Germany.
We are pleased to be able to invite excellent researchers to contribute their expertise to this important field. The book will cover the recent trends and applications of different perovskite materials in different trends and fields. It will also be focusing on the Future, Challenges and Applications of perovskite materials in different trends.
LikeLike
Artist hard work is rewarded . He keeps smiling and boosting his research progress . Science is important.
https://obadaprize.com/portfolio-types/young-distinguished-researchers/
LikeLike
” Obada-Prize is an international award. Initiated as a recognition of his excellence Professor Abdel-Shafy Obada. ”
Excuse me, but even Tiwari didn’t name his phony IAAM award after himself.
What kind of scam is that and how much did Shalan pay?
LikeLike