
I obtained the full report on the case of Karin Dahlman-Wright, cancer researcher and former Rector (presently Vice-Rector) of the Karolinska Institutet (KI) in Stockholm, Sweden. The research misconduct investigation was based on the evidence I received in July 2018 from several experts and published on my site, which was then repeatedly supplemented by further evidence from Johan Thyberg, KI professor emeritus and research integrity activist. Because of the high status of Dahlman-Wright at KI, the investigation was not run aground in house (like before, in Macchiarini-affären or here and here), but outsourced to the University of Gothenburg, who in turn invited an opinion from the Central Ethics Review Board (CEPN) in Sweden. On 26.11.2018, CEPN invited an external expert, the Danish physiology researcher and professor at University of Copenhagen, Nils Billestrup.
It is this Billestrup report, dated 8.03.2019, which I obtained via Thyberg, and which I now publish here. In brief, it analyses 8 papers from Dahlman-Wright’s lab and finds manipulated data in 6 of them. Two papers are suspected to have their validity undermined, at least in part, another paper is criticised for an incomplete correction, already published. In other 3 publications, the digital manipulations are declared to “probably not affect the conclusions made in the papers”, because Billestrup doesn’t seem to believe in loading controls. The main responsibility for serious stuff seems to have been appropriated to junior authors. In 2 papers, evidence was declared as false accusations of duplicated gel bands, though my own visual inspection suggest this assumption can be premature, especially since no original data was requested or screened in those instances. I previously published some of the raw data provided by Dahlman-Wright to KI, it turned out it didn’t match the published results, or was not available as original gel scans. Incidentally, also Dahlman-Wright’s successor, the current KI rector Ole Petter Ottersen, was asked to explain a gel. KI Chairman Mikael Odenberg expressed his support for both in this official blog even before the investigations began.
The Billestrup final report for CEPN, titled “Report concerning allegations of scientific misconduct by Professor Karin Dahlman-Wright”, is 14 pages long and is available here. It will now serve as basis for CEPN recommendation to University of Gothenburg, who will then make their own report to KI, who announced to accept the Gothenburg decision. This means, the Billestrup report is not a final decision, it will be hopefully amended with extra analysis by professional image integrity experts in certain disputable instances. I will provide below an illustrated critical overview of the report.
Paper 1:
Marko Matic , Galyna Bryzgalova , Hui Gao , Per Antonson , Patricia Humire , Yoko Omoto ,Neil Portwood , Camilla Pramfalk , Suad Efendic , Per-Olof Berggren, Jan-Åke Gustafsson and Karin Dahlman-Wright
Estrogen signalling and the metabolic syndrome: targeting the hepatic
estrogen receptor alpha action.
PLoS ONE (2013) doi: 10.1371/journal.pone.0057458
Allegation: In Figure 2 “Parts of one and the same micrograph has been used to illustrate two different things (liver sections from control and LERKO mice, respectively)”.

From the Billestrup report:
“In the initial submission to Plos ONE a different panel illustrating lipid staining in female LERKO mouse liver was used. A reviewer criticized the figure stating that while the authors write in the results section that “liver lipid deposits are not increased by ablation of ERct in liver…” the photograph shown, indicate that there is increased staining in the liver of female LERKO mice and the reviewer asks for a more quantitative analysis of lipid content in the liver from the mice.
In response to the criticism the authors perform a quantitative analysis of lipid content in the livers of male and female control and LERKO mice and include this new figure in the supplemental material. The conclusion from this quantitative analysis is that there is no difference in lipid content between control and LERKO mice. However, the authors do not change the panel in Figure 2 showing lipid staining in female LERKO mouse liver.
In the second review, it is criticized that while the new quantitative analysis shows no significant change in lipid content between control and LERKO mouse livers, the image shown in Figure 2 is not representative and should be modified. In the final submission the authors replace the panel showing lipid staining in female LERKO mouse liver with a micrograph that with all likelihood is from the same micrograph as that used to illustrate lipid staining in control female mice.
With the information provided, it is not possible to determine whether the use of the same micrograph to illustrate two different experimental conditions was performed intentionally or whether it was an honest mistake”.
Let me sum up. The authors duplicated the Control (CT) image because reviewers complained the LERKO signal showed something different than what the authors claimed. The “representative” image had to fit to quantifications which were accepted as absolutely correct (raw data was not requested here), and because the LERKO mouse liver picture did not fit the numbers, it was probably an “honest mistake” to replace it with a picture of control liver, to pacify the reviewers.
Verdict: more diligence when bullshitting reviewers!
“Other data in the paper as well as subsequent data provided from the authors support the general findings of the paper and the overall conclusions of the paper are not affected by the error.”
Paper 2:
Yichun Qiao, Chiou-Nan Shiue , Jian Zhu , Ting Zhuang , Philip Jonsson , Anthony P.H. Wright, Chunyan Zhao, Karin Dahlman-Wright.
AP-1-mediated chromatin looping regulates ZEB2 transcription: new insights into TNFa-induced epithelial-mesenchymal transition in triple-negative breast cancer.
Oncotarget (2015) doi: 10.18632/oncotarget.3158
The 2nd allegation was dismissed because the authors openly wrote in the text of the paper to have duplicated an image.
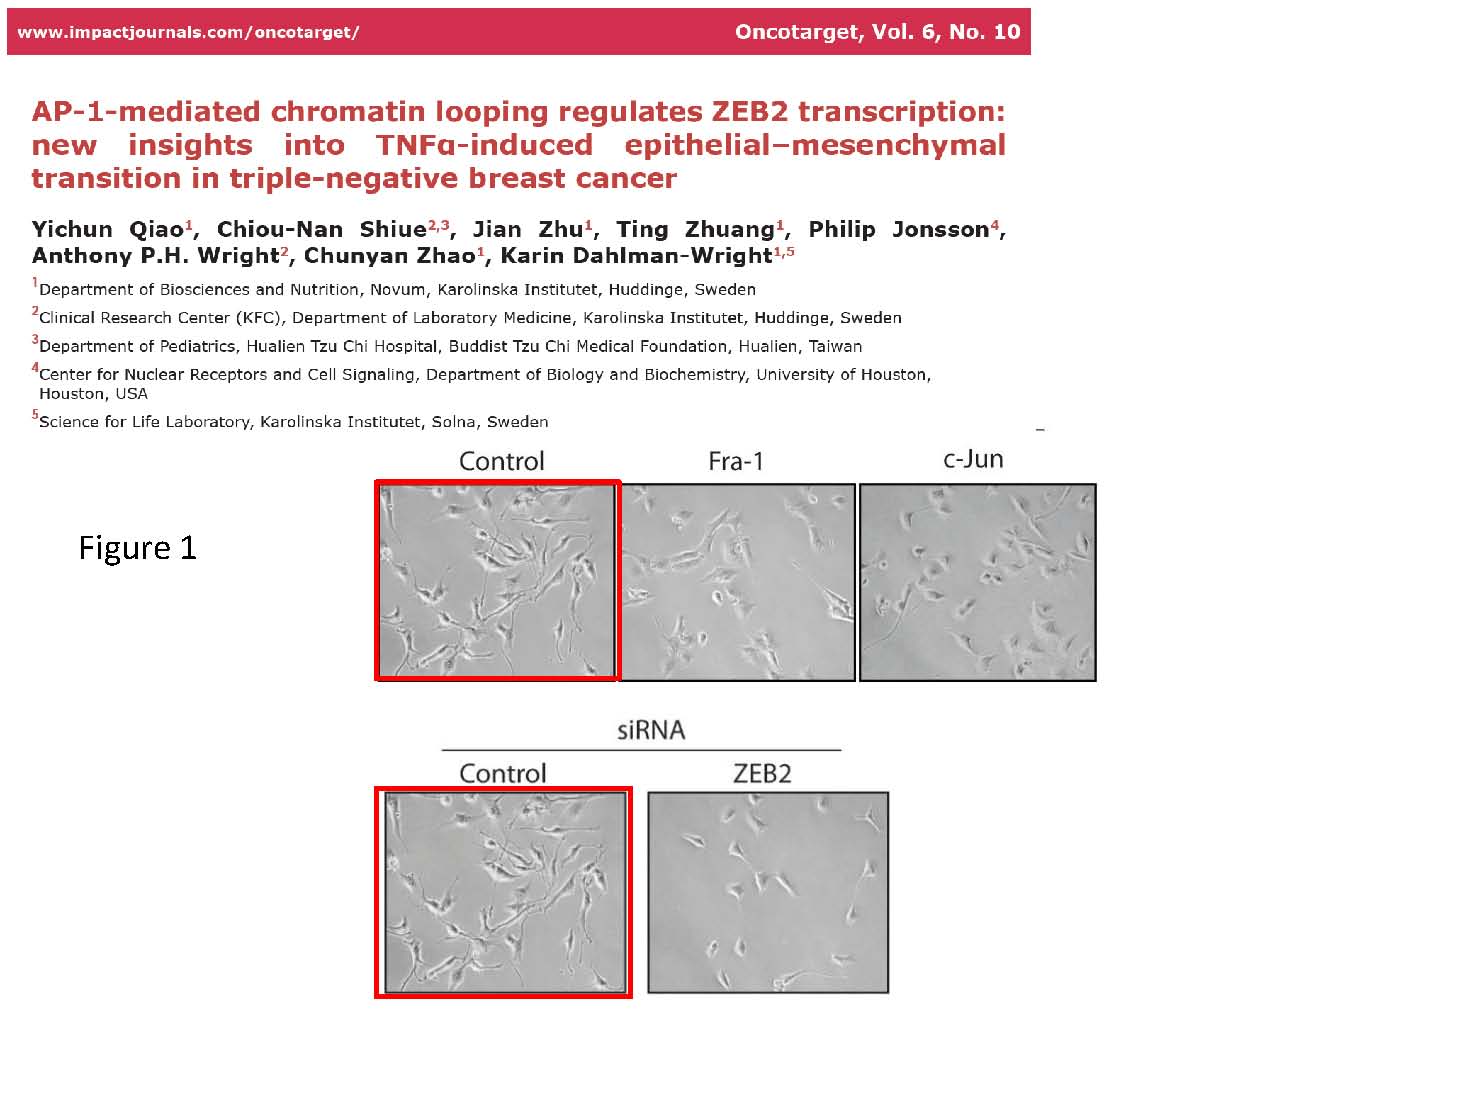
“Allegation 2. The same image of cells is used in two different panels of Figure 1. This is stated clearly in the figure legend to Figure 1 in the paper “The same image for control siRNA is shown for Figure 1B and Figure 1C because all conditions were assessed in the same experiment”. This is acceptable conduct with full transparency and a valid scientific reason for using the same image.”
Well, actually, not exactly. How do we know that image of control cells is representative if the authors ever took one single image, which they then had to reuse? A proper peer reviewer would have protested, but then again, the journal Oncotraget was delisted by MedLine and Clarivate in late 2017.
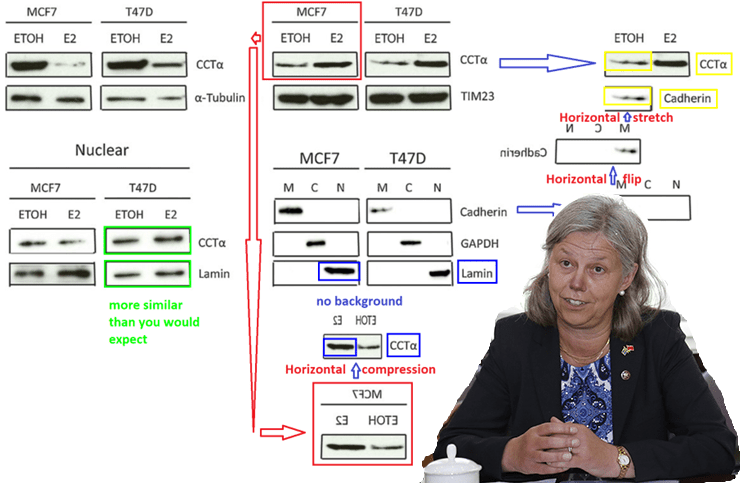
The Billestrup report addresses this duplicated loading control as Allegation 1:
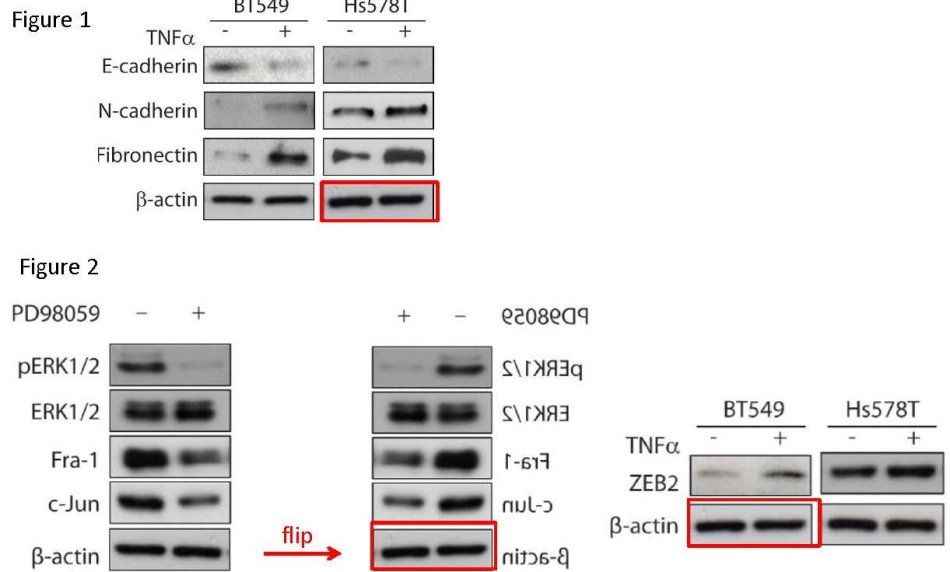
“The authors admit to having used the same image representing β-actin bands in western blot analysis when showing data from 3 different experiments (Figure 1A β-actin from Hs578T cells cultured with or without TNFoc, Figure 2B P-actin from BT549 cells cultured with or without PD98059 and Figure 2C β-actin from BT549 cells cultured with or without TNFa. […]
Yichun Qiao admits to using the same scanned image for all three figure panels. Stress induced by sudden travel requirements in connection with pregnancy and delivery is given as an explanation for the inappropriate use of the same β-actin bands in 3 figures. Yichun Qiao explains that she did not notice that she scanned the same film several times and saved these images under different names. The use of the flipped image is explained as scanning of the unmarked film from the back-side. […] Karin Dahlman-Wright: “The same Actin blot was accidentally scanned several times but given different names As the Actin levels are very similar between lanes as the same amount of protein is loaded, this was not noted when the manuscript was later assembled” […]
The authors have subsequently reanalyzed the original material and provide convincing evidence that the 13-actin bands were indeed of similar intensity under the various conditions. The image used to report data from 3 different experimental conditions represents the loading control 13-actin and therefore probably will have little consequence for the validity of the conclusions made. Equal amount of protein is loaded onto the gels and therefore a certain degree of normalization is achieved.”.
Billestrup was surprised why anyone would scan unmarked gels and thus accidentally flip them:
“Unmarked films should not be used as data for scientific publications”.
After all, how do you know what any gel shows if you haven’t labelled it? Every lab labels its gel scans, otherwise what’s the point? Unless of course, it doesn’t matter what the gel originally showed, rather what the final figure should show. The report’s conclusion on this paper is:
“the fact that the same image was used 3 times and one of them used a flipped image makes it less likely that an honest mistake can explain the error. Since the duplicated bands represents loading controls, the validity of the conclusions in the paper are most
likely not compromised”.
Verdict: It’s just controls, you know!
Paper 3:
Min Jia , Trygve Andreassen , Lasse Jensen , Tone Frost Bathen , Indranil Sinha ,
Hui Gao , Chunyan Zhao , Lars-Arne Haldosen , Yihai Cao , Leonard Girnita ,
Siver Andreas Moestue , and Karin Dahlman-Wright.
Estrogen Receptor a Promotes Breast Cancer by Reprogramming Choline Metabolism
Cancer Res. 2016 doi: 10.1158/0008-5472.CAN-15-2910

Allegation 1 was “Duplication of bands in Figure 4A representing lamin and CCTa.”. The report addresses it as such:
“The authors do not deny that the duplications of bands have taken place. Analysis of the bands representing CCTa and lamin in various panels of Figure 4A show that these
with high probability are from the same original image. […]
Karin Dahlman-Wright writes that she received a different version of this figure on March 11, 2016. This version did not contain the panels showing nuclear localization of CCTα and a different version of the panel showing the various markers for cytosolic, membrane and nuclear fractions compared to the version that was submitted on March 16 and subsequently published. Furthermore Karin Dahlman-Wright states “Why [Min Jia] in the following days (Between March 11th and March 16th ) prepares a new figure 4A including data from nuclear fraction (and up-dates figure legends, results section, materials and methods accordingly) remains unclear and KDW was not informed about this”. It can be inferred from this statement that Karin Dahlman-Wright did not see and approve the final version of the submitted manuscript. […]
In the statement given by Min Jia […] it is furthermore explained that” I did not store the scanned images safely, and Karin’ lab did not keep the film of the experiment”. […]
The use of duplicated bands in Figure 4A does raise concern about the validity of the data presented in this figure. However, the majority of the conclusions in the paper are not affected by these errors”.
Allegation 2 was about “Duplication of bands in Figure 4A and Figure 6A representing TIM23 and p-actin”. That was solved quickly, because who needs loading controls:
“The bands from Figure 4A representing TIM23 from the membrane fraction of
T47D cells are identical to those from Figure 6A representing p-actin from LCC2 cells.
Analysis of the bands in question reveal that they are with a high degree of confidence identical. […] However, since both TIM23 and 3-actin were used as loading controls
the error will probably not affect the overall conclusions of the paper”.
Verdict: It’s mostly just controls, if needed, throw postdoc under the bus!
Paper 4:
J Zhu , C Zhao , A Kharman-Biz , T Zhuang , P Jonsson, N Liang , C Williams, C-Y Lin , Y Qiao , K Zendehdel , S Strömblad, E Treuter, K Dahlman-Wright.
The atypical ubiquitin ligase RNF31 stabilizes estrogen receptor a and
modulates estrogen-stimulated breast cancer cell proliferation
Oncogene. 2014. doi: 10.1038/onc.2013.573.

Allegation 1 was “Duplication of bands in Figure 6e and 6c representing ERa and GAPDH, respectively and use of same image to illustrate RNF31 in Figure 6e and c.”. Report explains:
“The authors have admitted the use of the same image to represent GAPDH in Figure 6c and ERa in Figure 6e. Also, they admit to have used the same image to represent RNF31 in Figures 6c and e, although different experiments were performed. […] [Jian Zhu] stated that the error took place after acceptance of the paper when the publisher
requested images of higher resolution for final publication production. […] A correction of Figure 6 was requested by the authors and this was published in Oncogene on September 27, 2018″
This is the correction notice:
“Since the publication of the above article, the authors have noted that the input data in Fig. 6E is incorrect. The correct data are included in the below Fig. 6E. The mistake does not affect the conclusions of the paper as the levels of input proteins remain similar between samples”
Billestrup remains unconvinced this correction was sufficient:
“How can one blot then show bands representing both RNF31 and GAPDH, when different antibodies are required for the identification? In the Materials and Methods section of the paper it is described that the antibody used to detect GAPDH was ab8425 from Abcam. The Abcam website identifies antibody ab8425 as an anti-RAIDD antibody
and not an anti-GAPDH antibody”

Allegation 2 was however dismissed, in that case probably justified:
“Analysis of the bands used to represent GAPDH in Figure 4d (siControl) and GAPDH in Figure 6c show that these bands are most like not identical. This is based on specific features of the bands, where the distance between bands is the most obvious differences between the images”.
Verdict: “possible impact on the overall conclusions of the paper”
Paper 5:
Yawen Liu, Hui Gao, Troels Torben Marstrand, Anders Ström, Eivind Valen, Albin Sandelin, Jan-Ake Gustafsson, Karin Dahlman-Wright.
The genome landscape of ERalpha- and ERbeta-binding DNA regions
Proc Natl Acad Sci U S A. 2008 doi: 10.1073/pnas.0712085105.
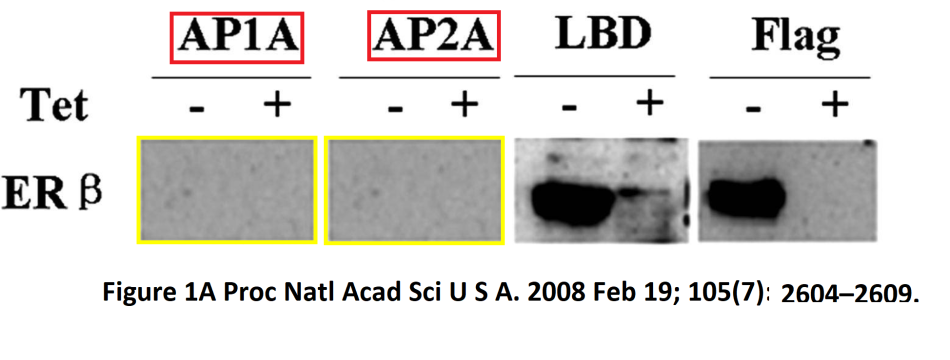
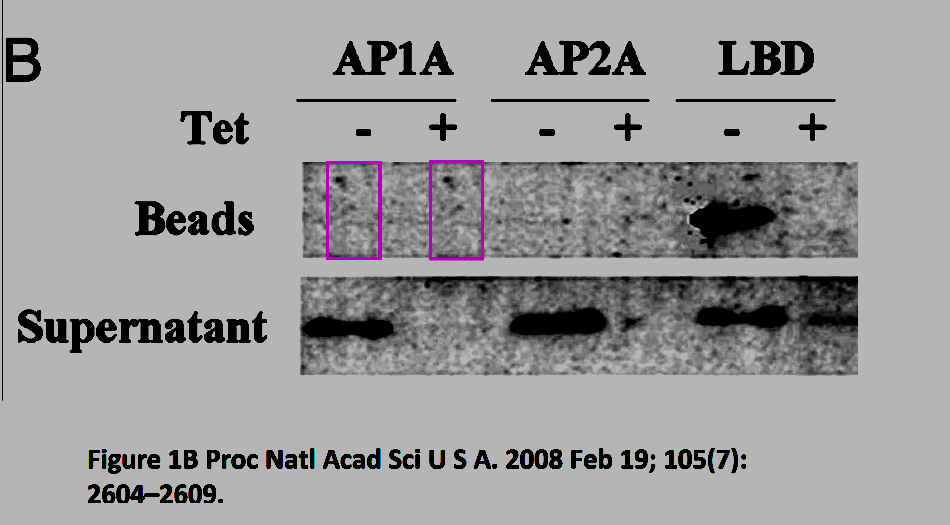
The duplication in Figure 1A was treated as Allegation 1:
“Yawen Liu admits to negligence (copying of images), but still insists that the figure is consistent with the original data. When analyzing the original film in document; […] there are clearly 3 bands present in lanes 7 and 8 at a position similar to that of ERβ. The bands have higher intensity in the extract from cells cultured without tet (-) compared to with tet (+) indicating repression by tet which is consistent with the bands representing ERβ, since the cells were generated using the tet-off system for FLAG-ERβ. […] Yawen Liu states: “After I reported these results in group meeting, group members believe that there were no bands of ERβ for AP1A and AP2A because of difference in molecular weight.” This explanation is not consistent with the principles of responsible conduct of research and transparency in reporting data. One can not “believe that there were no bands.” when the data clearly shows the presence of bands with similar molecular weight.
There is very strong evidence for data falsification in the generation of Figure 1A. However, the validity of the conclusions made in the paper are most likely not affected by the error.
The main results in the paper are produced using the LBD antibody and the manipulated data in Figure 1A do not concern the LBD antibody.”
Hello reader, are you OK there? Why are you banging your head against your desk? Don’t you follow Prof Billestrup on his quest to save Prof Dahlman-Wright from herself? Pull yourself together, reader, for now something even better comes.
“Allegation 2. Analysis of the images used to depict ERf3 in the immunopricipitate [sic!] using the AP1A antibody in Figure 1B show that these images with very high probability are not identical. […] Removing bands from gel images is acceptable conduct when it is considered that the removed image represents results that are not relevant for the paper. It is important that the spliced images are from the same film with the same exposure and this seems to be the case for Figure 1B. No improper image manipulation could be found in Figure 1B”.
Would you like to see those “not identical” patches of background? Now you understand why Billestrup and Dahlman-Wright agreed it was for the best not to search for original data:
Next, Allegation 3. That was too obvious a fraud, especially after Billestrup saw the raw data. “Analysis of the image used to depict ERβ in Figure 1C in the immunoprecipitate (bead
fraction) using the LBD antibody show that this image has with high probability been manipulated and does not represent the original data in a truthful manner. The analysis is based on two observations. Most importantly, the vertical position of the band in question is significantly different in the published Figure 1C from that found in the original film […] The position of the band representing ERβ has been changed so it
is aligned with the ERβ band from the other samples in the western blot analysis shown in Figure 1C. In addition to the lack of identity between the published and original data, there are also clear signs of manipulation of the band shown in the published Figure 1C. Clear and sharp lines forming a rectangle are present around the band strongly indicating that this has been repositioned by cut and paste. In the document “Yttrande Yawn Liu.doc” Yawen Liu denies manipulation of the image in Figure 1C and explain the square around the band as being caused by “splotch”. “
It seems, most of Dahlman-Wright’s scientific output can be explained as a “splotch”. It cannot be explained by a conspiracy among applicants to Dahlman-Wright lab, given that so many of them are unable to assemble a figure honestly. Dare we think their Principal Investigator might share a responsibility?
Billestrup concludes:
“Misrepresentation of the bands in the western blot in Figure 1A when using the AP2A antibody is of little consequence for the main conclusions of the paper, since this antibody was not used in the further analysis. The manipulation of the ERβ band in Figure 1C could potentially affect the validity of the conclusions made in the paper. […] However, if the antibody is indeed specific for ERβ, the manipulation will have little consequence for the validity of the conclusions made in the paper”.
Can you already see Dahlman-Wright and entire KI leadership nod approvingly that indeed, all those fake figures had no scientific meaning anyway and were included in the paper to fill in empty space? The paper was already corrected by PNAS on 22.01.2019:
“the final interpretation of the results of Fig. 1, and thus the article as a whole, remain unchanged. The student, who is the first author and the one who composed the pictures of the Western blots, did cut and paste bands. This was done to remove bands that were not relevant to the study. This was not stated on the images or within the figure legends”.
Billestrup however criticises this correction as misleading, and points out that the student Liu was actually postdoc at that time. He never considers retraction as a better option, because, see above.
Verdict: Postdoc, meet bus.
The next analysed paper did not come from Dahlman-Wright lab, this was probably why it was decided that the gels there were not manipulated. It comes from the lab of Sebastiano Ando from University of Calabria in Italy. Worth cross-checking his name on PubPeer, especially the paper Carpino et al 2007 from Ando lab, but Billestrup didn’t do that apparently.
Paper 6:
Pietro Rizza , Ines Barone, Domenico Zito, Francesca Giordano, Marilena Lanzino , Francesca De Amicis , Loredana Mauro, Diego Sisci , Stefania Catalano, Karin Dahlman
Dahlman Wright , Jan-Ake Gustafsson, Sebastiano Ando.
Estrogen receptor beta as a novel target of androgen receptor action in breast
cancer cell lines.
Breast Cancer Res. 2014 doi: 10.1186/bcr3619.

This is the entire analysis:
“Allegation 1. Analysis of the bands representing GAPDH in Figure 1C shows that they are most likely not identical and not produced by image duplication. This analysis is based on visual inspection of high magnification of the image. Several prominent features are clearly different when bands from MCF-7ce11s are compared to those from ZR-75 cells.
Allegation 2. Analysis of the bands in lanes 4 and 6 in Figure 6A shows that they are most likely not identical and not produced by image duplication. This analysis is based on visual inspection of high magnification of the image. Several prominent features are clearly different when band in lane 4 is compared to that from lane 6.
Conclusion: There is no evidence for manipulations in the generation of the images used for Figures 1C and 4A.”
Allegation 2 actually addressed Figure 4A, not 6A, that one is just a diagram. I enhanced the signal, and now not only do bands in lanes 4 and 6 look very similar, but also bands in lanes 1 and 3 warrant some attention. And why is background noise signal completely absent in most of the picture? If one deals with an enhanced image like this, a “ visual inspection of high magnification” alone, in absence of raw data, is not likely to provide any significantly novel insights. The argument on Allegation 1 makes sense only initially.
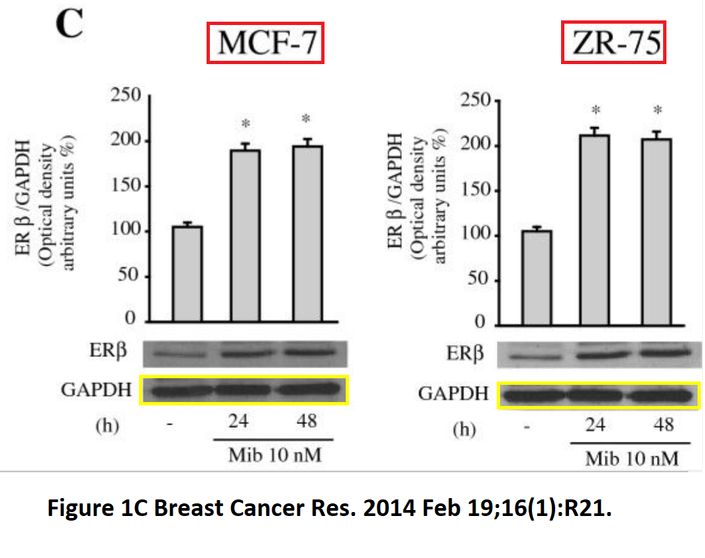
The bands are very slightly dissimilar indeed, but it still would help to ask for raw data. In any case, how does the Billestrup lab in Copenhagen do its western blots? We already know the professor has no high views on loading controls, but it is rather obvious that ERβ and GAPDH-probed samples never were on the same gel. The bands simply are too different, in shape, width and distance from each other. Here, authors even quantified the ERβ signal, yet how did they do it if the GAPDH loading controls were not made for each gel? Maybe someone should explain the concept of gel loading controls to Billestrup (obviously it is too late for Dahlman-Wright)?
Verdict: don’t stick your nose in Italian business!
Paper 7:
L Lundholm , G Bryzgalova , H Gao , N Portwood , S Fält, K D Berndt, A Dicker, D Galuska, J R Zierath , J-A Gustafsson , S Efendic, K Dahlman-Wright, A Khan.
The estrogen receptor {alpha}-selective agonist propyl pyrazole triol improves
glucose tolerance in ob/ob mice; potential molecular mechanisms.
The Journal of endocrinology (2008) doi: 10.1677/JOE-08-0192

That was a very peculiar case, and here one must be fair and admit Billestrup did a very good job. It would have been easy to dismiss that PubPeer comment, but the investigator asked for raw data, and this was where a surprise arrived. After all, the paper is from 2008, and the age of a paper is often used to absolve irregular gel splicing. Turned out, the small figure purportedly showing one control and one treated mouse hid mouse Frankenstein monsters instead, assembled from 2 different mice each:
“In response to the criticism a document (Paper 7_file description.docx) was provided. In this document the authors show the western blot analysis of livers from all 10 mice with respect to Stat3, Stat3P and Glucose-6-phosphatase. Furthermore, it is shown by arrows which specific bands were used to generate Figure 10a. It can be seen that the sample from mouse # 5 (vehicle) was used to show Stat3 and Stat3P and sample from mouse #2 (vehicle) was used to show Glucose-6-phosphatase. Sample from mouse # 6 (PPT) was used to show Stat3P and Glucose-6-phosphatase and sample from mouse #9 (PPT) was used to show Stat3. In other words, analysis of samples from different vehicle (#1 and #5) and different PPT (#6 and #9) treated mice were used to generate figure 10a. This is not acceptable conduct. When bands representing different proteins are shown and from two experimental groups (vehicle and PPT treated mice) samples from the same animal should be used to show different proteins in a representative western blot. In the legend to figure 10 it is stated: “A representative sample is shown from (a) one PPT-treated and one vehicle-treated liver, …”.
No wait, it gets better. The authors supplied Billestrup with gel scans without molecular weight labelling. But in the lab book, the weight markers were noted:
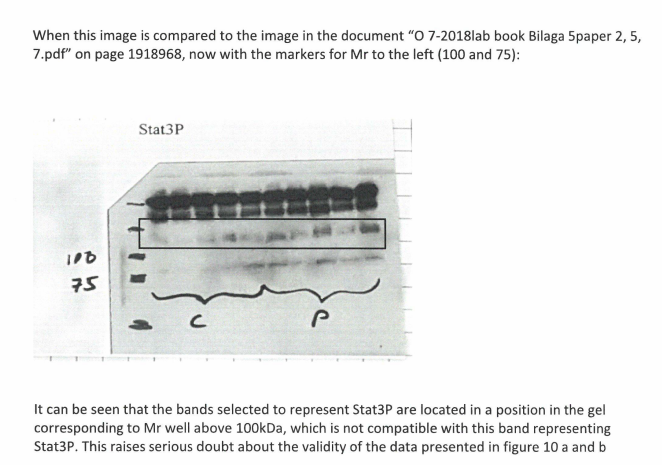
The band selected as Stat3P runs at around 110-120 kDa. Murine Stat3 protein runs (phosphorylated or not) at ~80-85 kDa, every grad student would know that that band was too high and hence plain wrong, unspecific, not to be used. KI is a world famous elite research institution, which issues the Nobel Prize in Medicine or Physiology. This paper’s coauthor Juleen Zierath is member of the Nobel Assembly. Do these international elites of biomedical research not know basic facts about western blot and protein molecular weight? Or do they take us all for a ride? Billestrup report concludes:
“The apparent Mr of the band identified as Stat3P by the authors does not correspond to the published Mr of this protein. If the validity of the Stat3P band can not be confirmed, this will affect some of the conclusions in the paper”.
Sounds like a discreet hint to Dahlman-Wright to shout out: “Wait! We mislabelled the marker! It should be 75 where it says 100!” (applause from KI, case closed, not even correction is necessary).
Verdict: Would you like to relabel your marker, Karin?
Paper 8:
Lindberg MK, Weihua Z, Andersson N, Movérare S, Gao H, Vidal O, Erlandsson M, Windahl S, Andersson G, Lubahn DB, Carlsten H, Dahlman-Wright K, Gustafsson JA, Ohlsson C
Estrogen receptor specificity for the effects of estrogen in ovariectomized mice.
J Endocrinol. 2002. doi: 10.1677/joe.0.1740167
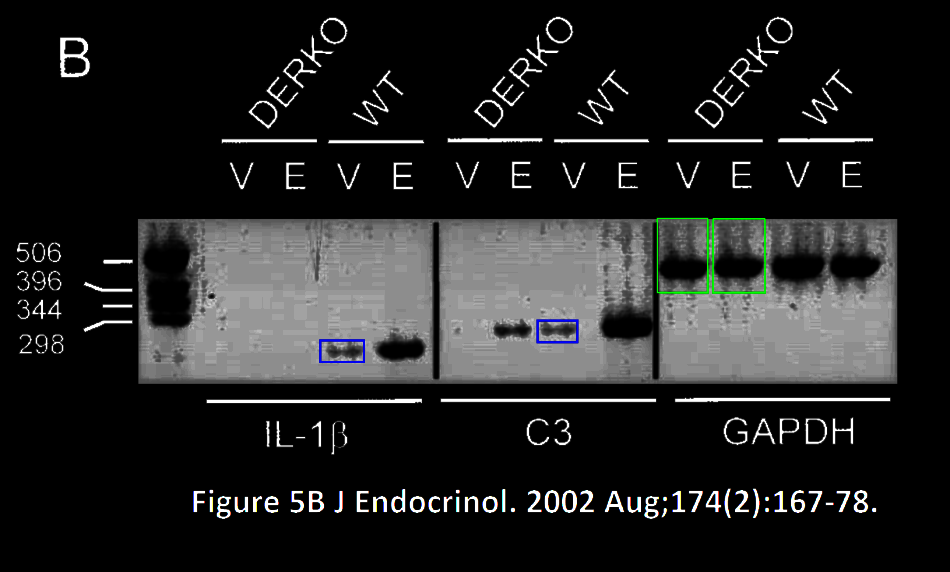
Before judging this figure, you should know who Jan–Åke Gustafsson is, we met him before for example in Paper 6, where also no band was ever found duplicated. Gustafsson is namely Dahlman-Wright’s PhD mentor and former Chairman of the Nobel Assembly. He left KI for Texas in 2008, after some affairs, both financial and sexual, details of these scandals are catalogued by Thyberg here. Which ever way you feel about Gustafsson, KI is immensely proud of him. Now guess what?
“Analysis of the bands representing IL-lβ and C3 transcripts in Figure 5B shows that they are most likely not identical and not produced by image duplication. This analysis is based on visual inspection of high magnification of the image. Several prominent features are clearly different when bands are compared.
Analysis of the bands representing GAPDH transcripts in Figure 5B shows that they
are most likely not identical and not produced by image duplication. This analysis is based on visual inspection of high magnification of the image. Several prominent features are clearly different when band representing GAPDH from vehicle treated DERKO mice is compared to that from estradiol treated DERKO mice. is compared to that from lane 6.”
Verdict: visual inspection, friends!


Donate!
If you are interested to support my work, you can leave here a small tip of $5. Or several of small tips, just increase the amount as you like (2x=€10; 5x=€25). Your generous patronage of my journalism will be most appreciated!
€5.00


Is Billestrup compromised or paid?
Falsification is NOT an Error. Falsification is fraud and thus the papers are based on fraudulent science and MUST be retracted. No proof is shown for conclusions not being affected. What an unacceptable way to report on scientific misconduct.
Somebody could file a formal complaint over Billestrup’s report as it in itself appears as scientific questionable practise or conduct.
LikeLike
Pingback: No pasaran - Ocasapiens - Blog - Repubblica.it
I fully agree. Falsification of data should automatically lead to retraction. I would not trust anything in a paper if some data was found to be manipulated or falsified.
The fact that we sometime detect manipulations/falsifications is due to sloppiness by the authors, and actually it is quite surprising that we see so much of it.
Most of the presented results in papers are often opaque (graphical illustrations) and most of the research fraud is not possible to detect without analyzing the raw data.
LikeLike
Leonid it could be interesting to request a comment from the DK ‘investigator’
LikeLike
Prof Billestrup wrote to me he “cannot answer or comment” and redirected me to CEPN, who then redirected me to GU. So I send them all my article.
LikeLike
In paper 1 and figure 2: In the female LERKO Lipid image there is a vertical white line (about 1-2 pixels wide) to the left as long as the figure is high. Is that sloppy photoshopping by the authors? Seems like image manipulation to me.
I am talking about this image:

LikeLike
Pingback: Blagosklonny’s lawyer threatens me to love Oncotarget or else – For Better Science
Pingback: Misconduct findings fell KI Vice-President Dahlman-Wright – For Better Science
Pingback: Karolinska’s haunted leadership – For Better Science
Pingback: The Karin Dahlman-Wright Show – For Better Science